

Abstract
Background: To better understand the occurrence and operative treatment of peripheral nerve injury (PNI) and the potential need for additional resources, it is essential to define the frequency and distribution of peripheral nerve procedures being performed. The objective of this study was to evaluate Ontario’s wait times for delayed surgical treatment of traumatic PNI.
Methods: We retrieved data on wait times for peripheral nerve surgery from the Ontario Ministry of Health and Long-Term Care Wait Time Information System. We reviewed the wait times for delayed surgical treatment of traumatic PNI among adult patients (age ≥ 18 yr) from April 2009 to March 2018. Data collected included total cases, mean and median wait times, and demographic characteristics.
Results: Over the study period, 7313 delayed traumatic PNI operations were reported, with variability in the case volume distribution across Local Health Integration Networks (LHINs). The highest volume of procedures (2788) was performed in the Toronto Central LHIN, and the lowest volume (< 6) in the Waterloo Wellington and North Simcoe Muskoka LHINs. The population incidence of traumatic PNI requiring surgery was 5.1/10 000. The mean and median wait times from surgical decision to surgical repair were 45 and 27 days, respectively. Both the longest and shortest wait times occurred in LHINs with low case volumes. The provincial target wait time was met in 93% of cases, but women waited significantly longer than men (p < 0.001).
Conclusion: The provincial distribution of traumatic PNI surgery was variable, and the highest volumes were in the LHINs with large populations. The provincial wait time strategy for traumatic PNI surgery is effective, but women waited longer than men. Precise reporting from all hospitals is necessary to accurately capture and understand the delivery of care after traumatic PNI.
Peripheral nerve injury (PNI) can result in profound motor and sensory impairments with high levels of disability.1–4 When a PNI does not resolve spontaneously, timely surgical intervention is essential to provide the opportunity for nerve regeneration. Surgical delay decreases the likelihood of optimal sensory and motor recovery, which negatively affects functional recovery.5–7 It is estimated that PNI has an annual cost of US$150 billion in the United States.8
In 2004, the Ontario Ministry of Health and Long-Term Care (now the Ministry of Health) launched the Wait Time Strategy, which was designed to improve access to health care services, specifically targeting surgical procedures and diagnostic imaging.9 In Ontario’s single-payer health care system, access to surgical services can include wait times for the consultation with a surgical specialist and then an additional wait for surgery. Target wait times are set by the province for each surgical priority as administrative benchmarks based on available evidence to improve overall patient access and outcomes.10
In Ontario, peripheral nerve operations are divided into 2 categories by the Ministry of Health: delayed traumatic PNI procedures and other peripheral nerve procedures. Delayed traumatic PNI operations involve any procedure for a traumatic PNI performed more than 24 hours after the time of the referral. The second category includes all procedures for nontraumatic PNI.
To better understand the occurrence and operative treatment of PNI and the potential need for additional resources, it is essential to define the frequency and distribution of peripheral nerve procedures being performed. Previous authors have investigated the prevalence and overall treatment trends of PNI, including reviews of individual surgical practices,11–15 but, to our knowledge, no recent system-wide analyses have been reported. The purpose of the present study was to evaluate the use of health care services and wait times for delayed traumatic PNI surgery in Ontario.
Methods
We retrieved data on wait times for peripheral nerve surgery from the Wait Time Information System, which was provided by Ontario Health (Cancer Care Ontario). The database includes all surgical procedures completed in fully equipped and publicly funded operating rooms in Ontario. We reviewed the wait times for delayed surgical treatment of traumatic PNI among adult patients (age ≥ 18 yr) from April 2009 to March 2018. We included procedures performed more than 24 hours from the time of referral, including excision, repair or release of peripheral nerves and the brachial plexus. We excluded traumatic PNIs that were repaired within the first 24 hours after referral.
Two wait times are reported in the Wait Time Information System: the time from referral to first consultation with the surgical specialist (wait 1), and the time from consultation to the date of the surgical procedure (wait 2) (Figure 1). Wait 1 reporting started in 2013, and more detailed reporting of wait 2 began in 2009.

Overview of wait 1 (amount of time a patient waits for a surgical consultation) and wait 2 (amount of time a patient waits from the consultation to the date of the surgical procedure) times.
Table 1 summarizes the priority classification for delayed traumatic PNI surgery in adults by the provincial Wait Time Strategy. The priority classification was developed by Ontario Health, and a summary version is published online.16
Priority classification for surgical treatment of traumatic peripheral nerve injury in adults16
Investigational data were publicly available, so this study was exempt from research ethics board review.
Statistical analysis
We reported the total number of surgical procedures and the mean, median and 90th percentile of the wait times as they were reported by the Ministry of Health. We categorized procedures based on surgeon’s specialty (not included in the reported data before 2010), whether they were performed within the provincial target time and the geographic location of the operative procedure by Local Health Integration Network (LHIN). We also compared the patients’ residence to the location of treatment, defined by LHIN.
We reported data as frequency and range for categoric variables, and mean and standard deviation or median and range for continuous variables based on the available information from the Ministry of Health. We performed univariate comparison of wait times by sex using Wilcoxon rank sum tests owing to the nonparametric nature of the data.
Results
From April 2009 to March 2018, 38 835 peripheral nerve operations (mean 4315/yr) were performed in Ontario by plastic surgeons and neurosurgeons. This number includes all procedures for traumatic and nontraumatic cases (e.g., repair of a digital nerve, carpal tunnel release, repair of facial nerve). From January 2010 to March 2018, plastic surgeons performed 93% of cases, and neurosurgeons performed 7% of cases.
Of the 38 835 operations, 7313 (18.8%) were delayed traumatic PNI surgical procedures (mean 813/yr). The volume of procedures varied by LHIN: the highest volume performed (2788) was in the Toronto Central LHIN, and the lowest volume (< 6) was in the Waterloo Wellington and North Simcoe Muskoka LHINs (Figure 2 and Table 2).

Volume of delayed surgical procedures for traumatic peripheral nerve injury in Ontario, April 2009 to March 2018, by Local Health Integration Network.
Mean wait 1 and wait 2 times for delayed surgical treatment of traumatic peripheral nerve injury, April 2009 to March 2018, by Local Health Integration Network
The incidence proportion of delayed traumatic PNI surgical procedures during the study period, based on Ontario’s population,17 was 5.1/10 000 people. With the inclusion of nontraumatic cases, the overall incidence proportion of all PNI was 26.9/10 000 people.
Referral of patients from LHIN of residence to LHIN of treatment varied across the province. The highest proportion of referred patients were treated in the Toronto Central LHIN (48%), followed by the Central (20%) and Mississauga Halton (19%) LHINs (Table 3). The highest proportion of out-of-province patients were treated in the Central East LHIN, followed by the Toronto Central and Central LHINs (Table 3).
Local Health Integration Network (LHIN) of patient residence versus LHIN where surgery was performed
Wait times by priority level are presented in Table 4. The mean wait 1 duration was 42 days (median 24 d, 90th percentile 102 d), and the mean wait 2 duration was 45 days (median 27 d, 90th percentile 100 d) (Table 4). Overall, 93% of procedures were performed within the provincial target time. Table 4 also shows wait times for other peripheral nerve procedures by priority level.
Wait times for peripheral nerve surgery by priority level
The mean wait 1 times were significantly longer for women than for men (47 d v. 38 d, p < 0.001), as were the mean wait 2 times (46 d v. 43 d, p < 0.001) (Figure 3, Figure 4 and Table 5). Table 5 also shows wait times for other peripheral nerve procedures for the 2 sexes.
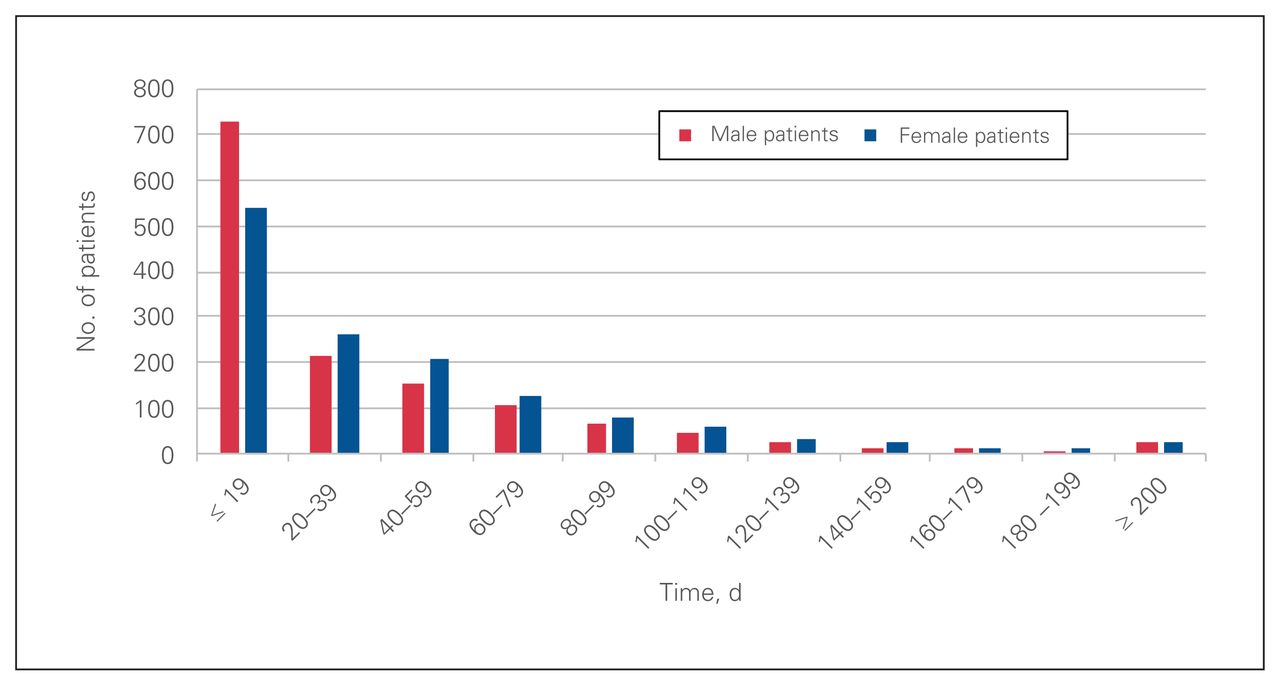
Wait 1 time for patients who underwent delayed surgical treatment of traumatic peripheral nerve injury stratified by sex.

Wait 2 time for patients who underwent delayed surgical treatment of traumatic peripheral nerve injury stratified by sex.
Wait times for peripheral nerve surgery by sex
Discussion
A high volume of elective and emergency peripheral nerve operations was performed in Ontario from April 2009 to March 2018. Target wait times were met in 93% of procedures. In general, the wait time strategy was effective in delayed traumatic PNI surgical procedures. However, patients with delayed access to care require special attention. Meeting the target wait times and reducing wait times may have a positive financial impact on both patients and society by improving overall access to care. A cost-effectiveness study in cataract surgery showed a reduction in health care costs when wait times are reduced and surgical availability is increased.18 This implies that reducing wait times not only may improve access to care, but also can be cost-effective.
Noble and colleagues14 reported an incidence of PNI of 2.8% at a level I trauma centre in Ontario. In our study, which includes data for the entire population of Ontario, we found an incidence proportion of PNI surgery of 26.9/10 000 people when we included the nontraumatic cases. The incidence proportion of delayed traumatic PNI surgery was 5.1/100 000 people. These are underestimates of the true incidence of PNI given our exclusion of priority 1 cases and ambulatory nonoperative cases. When we compare the incidence of delayed traumatic PNI surgery to that of appendectomy, which is estimated to be 92 per 100 000 person-years in Canada,19 the relatively common nature of delayed traumatic PNI surgery is apparent.
Our unadjusted analyses showed that wait times for delayed traumatic PNI surgery were different between the sexes; however, there did not appear to be a significant sex difference in the proportion of patients for whom waits 1 and 2 exceeded the guideline. Men were seen in consultation and had surgery in significantly less time than women. Similar results were reported in a study from southwestern Ontario, with longer wait times for women to see a specialist for all medical and surgical specialties from October 2005 to July 2010.20 In a US study, Song and colleagues21 found that, in a Medicare-aged population, women were less likely than men to have outpatient surgery; the difference was not explained by socioeconomic status. The authors cited variable communication styles between patients and their health care providers, known differences in clinical outcomes between male and female patients that may influence the surgeon’s decision, and distinct levels of risk tolerance between men and women when it comes to surgical procedures as possible explanations. Other studies have shown that women wait longer for elective cardiac surgery than men.22–24 Some investigators have attributed part of the observed differences to increased disease severity in men,22–24 whereas others have found differences in health insurance status23 and physicians’ perception that women are prone to worse clinical outcomes.24 However, most of the studies failed to find a single explanation that accounted for all the observed differences.21–23 It is difficult to postulate a reason for the observed sex differences in our study with the available data, but gender roles may have contributed. There may be certain factors, not measured in our study, that affect the willingness of women to undergo surgery.
Furthermore, sex differences in clinical outcomes have been observed in upper-extremity PNI. For example, women have up to a fourfold higher incidence of complex regional pain syndrome than men.25 The impact of delayed surgical care may also be worse in women: in an Australian study, Ackerman and colleagues26 identified poor health-related quality of life and significant psychologic distress that was worse among women in patients waiting for joint replacement surgery.
In the present study, the delay between consultation and surgery for both sexes may have been related to hospital resources and access to care. It may also have been the result of patient factors such as the need for further investigations before surgery. An Ontario study suggested that access to cataract surgery can explain the reported increase in wait times despite a decrease in surgery rates.27
We identified differences in wait times between high- and low-volume regions. Higher-volume regions may be associated with greater capacity, surgical expertise and programmatic service delivery, and may have lower morbidity and improved functional outcomes.28,29 This has been shown in such surgical specialties as rectal cancer surgery and breast cancer surgery.29,30 Some studies, including 2 conducted in Ontario, showed that high-volume centres were associated with longer wait times.31–34 In our study, the highest-volume LHIN, Toronto Central, had lower mean wait times than the provincial average. This finding is consistent with those of a study that assessed wait 2 times for colon cancer surgery in Ontario.35 Larger specialized centres with more operating facilities and resources are more likely to have shorter wait times than facilities with fewer operating rooms and resources. However, when the volume of cases exceeds the surgical capacity, delays are expected to occur. This may explain the lack of consistency in lower mean wait times across high-volume LHINs in our study. For example, among the high-volume centres, the Toronto Central, Mississauga Halton and Central LHINs had shorter wait times than South West LHIN. Our study also showed that, in certain LHINs such as Toronto Central, treatment was provided for a large proportion of patients from regions beyond adjacent LHINs. The subspecialties and resources available in LHINs such as Toronto Central may explain this finding.
Limitations
Limitations of this study include a lack of data on the reasons for the delay between consultation and surgery. We were unable to control for potential confounders that may explain the sex difference, as the data were provided as summaries. We were also unable to account for clinical characteristics, including open PNIs, that may have affected the urgency of surgery, as these data were not recorded in the wait time database. Wait times in regions with low volume may be skewed by outliers. Finally, analyses of retrospective data depend on the accuracy of the recorded data, and, therefore, our results are dependent on the data that were provided to the Ontario Ministry of Health. Precise reporting of PNI from all hospitals and linkage of the health information with other administrative databases are necessary to accurately capture and understand the delivery of care after traumatic PNI.36
Conclusion
Our findings indicate that, between April 2009 and March 2018, the distribution of delayed traumatic PNI surgery in Ontario was variable, and the highest volumes and shortest wait times were in the LHINs with large populations. The wait time to see a specialist (wait 1) and the wait time for surgery (wait 2) met the provincial target wait times in 94% and 93% of cases, respectively, but women waited longer than men to see a specialist and to undergo surgery. Future studies investigating the sex differences in wait times for delayed traumatic PNI surgery are required to identify the reasons for the observed gender disparities.
Acknowledgments
The authors thank Dr. Aaron M. Drucker and Dr. Allan S. Detsky for their thoughtful comments on the manuscript.
Footnotes
Presented in part at the Sunderland Society meeting, Dec. 4–6, 2016, Frankfurt, Germany, and the Canadian Society for Surgery of the Hand meeting, June 14, 2016, Ottawa, Ont.
Competing interests: Dimitri Anastakis reports financial compensation for work done as clinical lead of Plastic and Reconstructive Surgery, Access to Care, Ontario Health. No other competing interests were declared.
Contributors: All authors designed the study, acquired and analyzed the data, wrote and critically revised the manuscript, and gave final approval of the article to be published.
Disclaimer: Parts of this material are based on data and information that was provided by Ontario Health (Cancer Care Ontario). However, the opinions, reviews and conclusions reported in this publication are those of the authors and do not necessarily reflect those of Ontario Health (Cancer Care Ontario). No endorsement by Ontario Health (Cancer Care Ontario) is intended or should be inferred.
- Accepted January 11, 2021.
This is an Open Access article distributed in accordance with the terms of the Creative Commons Attribution (CC BY-NC-ND 4.0) licence, which permits use, distribution and reproduction in any medium, provided that the original publication is properly cited, the use is noncommercial (i.e., research or educational use), and no modifications or adaptations are made. See: https://creativecommons.org/licenses/by-nc-nd/4.0/.