


Abstract
Background. There is mounting evidence from experimental and clinical studies that the quality of organs from cadaver donors may be influenced by events occurring around the time of brain death, and that these may affect transplant outcome. The aim of this study is to investigate the influence of donor factors on renal allograft outcome in a homogeneous cohort of 518 patients transplanted in a single centre over a 9 year period.
Methods. Endpoints of the study were delayed graft function (DGF), acute rejection (AR), 1 year graft survival and long-term survival of those grafts that reached 1 year. Multivariate analysis was performed to determine factors that may have influenced the graft outcome indicators.
Results: DGF was the major predictor of graft failure overall with cold ischaemia time (CIT) as an important independent factor. The level of histocompatibility did not influence graft survival. DGF was the major factor affecting 1 year graft survival (P<0.0005) with effects persisting beyond 1 year. DGF was significantly influenced by CIT, donor age, female kidney into male recipient and donor creatinine (P<0.05). Other donor factors and factors associated with donor management were not risk factors for DGF, rejection episodes or graft survival. The risk factors for a number of AR episodes were HLA–DR mismatch and DGF (P<0.005). When grafts surviving for 1 year were considered, only CIT, recipient age and creatinine at 1 year (P<0.05) were found to affect graft survival significantly.
Conclusions. The results of this analysis of well-matched transplant recipients show that CIT and DGF are the most important predictors of poor short and long-term graft survival. Therefore, in order to improve the long-term survival of renal allografts efforts should focus on limiting CIT and the damage that occurs during this period and on improving our understanding of DGF.
Introduction
There is mounting evidence from experimental and clinical studies that the level of injury to organs from cadaver donors may be influenced by events occurring in the intensive care unit (ICU) [1] and around the time of brain death [2], and that these may affect subsequent transplant outcome.
Despite evidence that the quality of organs from cadaver donors is inferior to organs from living donors, it remains controversial whether this is associated with events in the management of the donor in ICU. For example, recent data suggest that the use of inotropes reduces the incidence of acute rejection (AR) and leads to superior long-term survival of the graft. While, in contrast, other studies have found a significant increase in delayed graft function (DGF) and reduced 1 year survival and renal function if the donor had required inotropes prior to death [1].
Having been exposed to factors related to the dying process other influences will be added to the donor organ which will impact on the final outcome of transplantation. These will be related to the retrieval process itself and the subsequent period of cold ischaemia before reperfusion. Finally, recipient factors will become active on reperfusion and for the lifetime of the graft. It is this blending of multiple donor and recipient factors that generates the final outcome of the transplant process.
The aim of this study was to analyse a comprehensive database of a large, homogenous cohort of patients transplanted in a single centre over a 9 year period in order to investigate the influence of donor and recipient factors on renal allograft function and survival.
Subjects and methods
Patients
Between 1991 and 1999, 541 cadaveric renal transplants were performed at the Oxford Transplant Centre. Data relating to donors and the retrieval process were obtained from the UK Transplant National Database Core Donor Data Form (Form CDD1) and from information kept locally by the transplant coordination team. Full donor data were available for 518 patients, which formed the study population. Twenty-three patients were excluded from the study due to the lack of donor data. All kidneys were retrieved from conventional heart-beating, cadaveric donors diagnosed as brain stem dead. The retrieval technique and preservation fluid were unchanged during the study period. A detailed list of the variables studied is given in Table 1. Donor details and recipient demographics are described in Table 2. Clinical and follow-up data were collected prospectively from the Oxford Transplant Centre Database.
List of variables studied
| Year of transplant | Donor cause of death | Recipient sex | DGF |
|---|---|---|---|
| Donor sex | Trauma Y/N | Recipient age | Acute rejection Y/N |
| Donor age | Cardiovascular disease Y/N | Recipient blood group | Acute rejection day-7 Y/N |
| Donor age </≥50 yr | Donor ventilation time (h) | Recipient Rhesus (±) | Acute rejection day-14 Y/N |
| Donor weight | Donor infection Y/N | Recipient blood transfusions Y/N | Methyl-prednisolone treatments |
| Donor height | Donor antibiotics | Recipient number of blood transfusions | Antithymoglobulin treatment |
| Donor SeCr | DDAVP Y/N | Cause of ESRF | SeCr and CrCla day-7 |
| Donor SeCr </≥150 µmol/l | Donor inotropes Y/N | First transplant/regraft | SeCr 3 and 6 months |
| Donor CrCla | Adrenaline Y/N | Days on transplant waiting list | Weight 3 and 6 months |
| Donor CrCla </≥60 ml/min | Dobutamine Y/N | Pre-transplant antibodiese | CrCla 3 and 6 months |
| Donor Se. sodium | Dopamine Y/N | Highly sensitizedf | Survival 3 and 6 months |
| Donor Se. potassium | Noradrenaline Y/N | HLA class I MM | SeCr 1–9 years |
| Donor blood group | Multiorgan/kidneys only | HLA class II MM | Weight 1–9 years |
| Donor Rhesus (±) | Local/imported organ | HLA A MM | CrCla 1–9 years |
| Donor CMV status (±) | Graft damagec | HLA B MM | Survival 1–9 years |
| Hypotension Y/Nb | Type of damage | HLA DR MM | Death with functioning graft |
| Cardiorespiratory arrest | Cold ischaemia timed | HLA MM | |
| Donor blood transfusion | Anastomosis time | Recipient CMV (±) |
aCalculated by the Cockcroft–Gault formula [(140–age) × (1.23♂/1.04♀) × weight (kg)/serum creatinine (SeCr) (µmol/l)].
bSystolic blood pressure ≤80 mmHg for >10 min.
cAny type of injury (vascular, ureteric or capsular) reported to the National Database by the retrieving surgeon or recorded at the recipient centre.
dTime from cold perfusion to the time the kidney was taken out of ice to start the anastomosis.
eHLA lymphocytotoxic antibodies reactive with ≥10% of a random panel.
fHLA lymphocytotoxic antibodies reactive with ≥85% of a random panel.
Donor and recipient demographics and retrieval factors
| Donor factors | |
| Sex, M:F | 281:237 |
| Age | 42±15.5 |
| Cause of death | |
| Trauma Y/N | 145/373 |
| CVD Y/N | 335/183 |
| CMV ± | 249/246 (N/A 23)a |
| Serum creatinine | 107±60 µmol/l |
| Creatinine clearance | 84.7±31.9 ml/min |
| ICU factors | |
| Cardiorespiratory arrest Y/N | 129/389 |
| Hypotension Y/N | 339/179 |
| Ventilation time | 55±47 (h) |
| Infection Y/N | 130/380 (N/A 8)a |
| DDAVP Y/N | 201/317 |
| Inotropes Y/N | 423/95 |
| Noradrenaline Y/N | 80/438 |
| Dobutamine Y/N | 130/388 |
| Dopamine Y/N | 299/219 |
| Adrenaline Y/N | 93/425 |
| Retrieval factors | |
| Local/imported | 367/151 |
| Damage | 85/433 |
| Cold ischaemia time | 23.6±8.6 (median = 21 h) |
| Anastomosis time | 44.7±2.1 (min) |
| Recipient factors | |
| Sex, M:F | 316:202 |
| Age | 46.4±12.7 |
| Cause of ESRF | |
| Diabetes Y/N | 55/463 |
| Pre-transplant antibodies Y/N | 241/277 |
| Highly sensitized Y/N | 38/480 |
| CMV ± | 259/222 (N/A 37)a |
| Days on waiting list | 338±480 (median = 168) (days) |
| Number of transplant 1:2:3:4 | 444:64:8:3 |
| HLA mismatches 0:1:2:3:4:5:6 | 33:73:114:139:122:32:5 |
| HLA DR mismatches 0:1:2 | 269:219:30 |
aData not available.
Immunosuppression
The immunosuppressive protocol used during the period studied was uniform and consisted of a triple-therapy regimen of cyclosporine (8 mg/kg/day divided in two doses), azathioprine (1.5 mg/kg/day) and prednisolone (20 mg/day if recipient weight 60 kg or above; 15 mg/day if weight was <60 kg). Cyclosporine dose was adjusted to maintain serum trough levels between 150–300 ng/ml in the first 6 months post-transplant and 75–150 ng/ml, thereafter. Prednisolone dose was reduced gradually after 2 months to 5 mg/day at 1 year. Most patients discontinued prednisolone at 18 months post transplantation. Induction therapy with antilymphocyte globulin (ATG) was used only in highly sensitized patients. There was no change to the immunosuppressive protocol in the presence of DGF. From July 1991, patients were started on aspirin 75 mg pre-transplantation and continued until 1 month after the transplant to prevent renal vein thrombosis.
Endpoints
The end points of the study were: DGF, AR, 1 year graft survival and long-term survival of those grafts that reached 1 year.
DGF was defined as the requirement for dialysis within the first week after transplantation. Patients transplanted prior to needing dialysis (pre-emptive transplantation) were considered to have DGF if the creatinine failed to drop in the first week.
AR was diagnosed histologically on core renal biopsies according to the Banff classification. Prior to the introduction of the Banff classification, rejection was diagnosed by a histopathologist on a qualitative basis. Biopsies were scored using the '93 Banff classification from 1996 to 1999, and the revised '97 Banff classification from April 1999. All patients in our unit had protocol renal transplant biopsies at days 7 and 28 after the transplant irrespective of renal function. In addition, diagnostic biopsies were performed at any time when clinically indicated. Three 500 mg doses of methyl-prednisolone were administered on consecutive days for the treatment of confirmed AR. A 10–14 days course of ATG was used to treat steroid-resistant rejection.
Uncensored 1 year graft survival and long-term survival of those grafts that reached 1 year includes those recipients who died with a functioning graft. Results from patients dying with a functioning graft were excluded from analysis as indicated. This was performed to maintain the focus of the study on the donor factors rather than recipient factors such as advanced cardiac disease, on graft survival.
Statistical analysis
Multivariate statistical tests with the SPSS (v12 for Windows) statistics program were used to analyse the data. Logistic regression was used to calculate the odds ratio (OR) for the analysis of DGF, AR and 1 year graft survival. Models were fitted on the basis of improved fit, as measured by change in chi-squared statistics. The statistical models were validated by the ‘Hosmer–Lemeshow’ goodness of fit test. The ‘Nagelkerke R2’ was used to evaluate the overall fit of the model [3].
Cox proportional hazard regression, log-rank analysis and Kaplan–Meier curves were used for the analysis and illustration of the survival of those grafts that reached 1 year and long-term graft survival.
Continuous variables, such as age and cold ischaemia time (CIT), were analysed as such in Cox and logistic regression. However, to permit the use of Kaplan–Meier curves plots were converted to binary variables, by splitting variables at the median.
The significance of results from logistic and proportional hazards regression were confirmed by examining changes in overall log-likelihood of the model.
Possible interactions were examined by comparing coefficients for one factor across levels of the other and calculating a ‘normal deviate’ [4].
Linear regression was used to study the factors affecting the 1 year creatinine.
To show further the effect of donor age and CIT, these variables were banded by quintiles.
Results
Overall study endpoints
DGF occurred in 31.1% (161/518) of the patients studied (Table 3). Fifty-four percent of recipients had at least one episode of biopsy-proven AR. Of the patients with AR, 35.7% had two or more episodes of rejection. Graft survival of 1 and 5 year after censoring for death with a functioning graft was 90.6 and 79.5%, respectively. The full data relating to the endpoints of the study are given in Table 3.
Endpoints of the cohort studied
| DGF | 161/518 | 31.1% |
| AR | 280/518 | 54% |
| No. of episodes of AR 1:2:3:4 | 180:64:29:7 | 34.7%:12.4%:5.6%:1.4% |
| 1 year graft survival | 445/491 | 90.6% |
| 5 year graft survival | 217/273 | 79.5% |
| Mortality with functioning graft in first year | 27/518 | 5.2% |
| Mortality with functioning graft in first 5 years | 35/318 | 11% |
Of the total set, 23 patients were excluded from the study due to the lack of donor data. However, the incidence of DGF, AR and 1 year graft survival in these 23 excluded patients (35, 43.5 and 90.5%, respectively) was comparable to the remainder.
Analysis of the factors affecting overall graft survival
Survival analysis methods were used to investigate the factors affecting the overall graft survival. DGF emerged as the dominant predictor of subsequent survival. Figures 1 and 2 show the Kaplan–Meier plots of the effects of DGF and CIT and associated log-rank statistics. For this analysis, CIT was categorized as being either above or below the median CIT of 21 h. It can be seen that CIT influenced the long-term survival of the graft significantly.
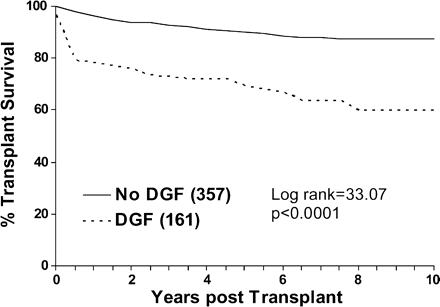
Effect of DGF on renal graft survival. Graft survival is censored for death.
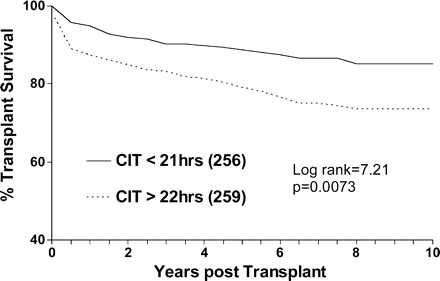
Effect of CIT on graft survival. Graft survival is censored for death.
Results of the proportional hazards regression are presented in Table 4.
Risk factors affecting the endpoints analysed in this study
| 95% CI | P-value | ||
|---|---|---|---|
| Overall graft survivala | HR | ||
| DGF | 2.92 | 1.84–4.63 | <0.001 |
| CIT (h) | 1.027 | 1.004–1.049 | 0.016 |
| AR | 1.15 | 0.73–1.82 | 0.54 |
| Overall graft survival (no DGF)a | HR | ||
| CIT | 1.023 | 0.98–1.07 | 0.28 |
| AR | 2.05 | 1.03–4.08 | 0.04 |
| Overall graft survival (DGF)a | HR | ||
| CIT | 1.029 | 1.004–1.053 | 0.021 |
| AR | 0.71 | 0.39–1.3 | 0.27 |
| 1-year graft survivala | OR | ||
| Tx year | 1.264 | 1.051–1.519 | 0.012 |
| DGF | 0.152 | 0.069–0.333 | <0.005 |
| Long-term survival of kidneys reaching 1 yeara | HR | ||
| Recipient age | 0.963 | 0.937–0.989 | 0.005 |
| CIT | 1.035 | 1.002–1.069 | 0.039 |
| SeCr 1Y | 1.006 | 1.006–1.0104 | <0.005 |
| Delayed graft function (DGF)b | OR | ||
| Donor age | 1.03 | 1.015–1.044 | <0.005 |
| Donor SeCr | 1.004 | 1.0004–1.008 | 0.028 |
| CIT | 1.066 | 1.041–1.092 | <0.005 |
| FtoM | 2.437 | 1.536–3.869 | <0.005 |
| Trauma | 0.328 | 0.154–0.699 | 0.004 |
| Acute rejection Y/Nb | OR | ||
| Donor age | 1.013 | 1.0006–1.026 | 0.039 |
| DR MM | 1.805 | 1.316–2.477 | <0.005 |
| DGF | 1.814 | 1.196–2.749 | 0.005 |
aFactors affecting the overall survival, and long-term survival of the grafts that reached 1 year, were obtained by Cox regression.
bFactors affecting DGF, AR and 1 year graft survival were obtained by logistic regression. Coefficients for continuous variables are expressed per unit of the variable (e.g. per year).
A ‘time-dependent covariate’ was used to test departure from the proportional hazards assumption. The effect was not significant, but was consistent with a tendency to earlier graft failure in the DGF group. This was confirmed by carrying out separate analyses for 0–3 months, 3 months to 1 year and after 1 year (Table 5) that also showed that the effect of DGF persisted. This post 1 year effect of DGF was not significant after the inclusion of 1 year creatinine, suggesting that this mediated the effect.
Effect of DGF on graft failure during different time periods
| Time period | Hazard ratio | 95% CI |
|---|---|---|
| 0–3 months | 14.1 | 4.9–40.9 |
| 3 months to 1 year | 2.9 | 0.94–9.1 |
| >1 year | 1.9 | 1.02–3.4 |
| Time period | Hazard ratio | 95% CI |
|---|---|---|
| 0–3 months | 14.1 | 4.9–40.9 |
| 3 months to 1 year | 2.9 | 0.94–9.1 |
| >1 year | 1.9 | 1.02–3.4 |
Diagnosis of rejection had no overall effect on failure; however, there was a significant interaction with DGF (z = 2.26, P = 0.024), with rejection significantly increasing failure in the absence of DGF (Table 4).
Factors affecting 1 year graft survival
The 1 year graft survival was studied by logistic regression. In this analysis, survival is treated as the outcome (with ‘death with functioning graft’ being omitted from the analysis), hence reduction in graft survival is indicated by an OR <1.0. One-year graft survival was influenced only by DGF and the year of transplant (Table 4). There were no adverse effects of donor factors or ICU management on 1 year graft survival.
Renal transplants performed in the early years of the study period had a significantly worse 1 year graft survival than those carried out in later years.
Importantly, no other factors were significant, including AR, HLA matching, highly sensitized recipients, re-grafts and donor age. Again, contrasting effects of rejection were found according to the occurrence of DGF, with rejection reducing graft survival in the absence of DGF. Neither result was significant individually; the test for interaction was (z = 2.0, P = 0.046).
Factors affecting long-term survival of the grafts that reached 1 year
Proportional hazards regression analysis was used to investigate factors affecting failure of grafts that survived beyond the 1 year post-transplant. The most important factor identified was serum creatinine at 1 year. CIT was also significant, as were donor and recipient age; older recipients had reduced graft loss (Table 4).
Creatinine clearance at 1 year had a weaker effect than creatinine, and no independent effect. In this analysis, re-grafts, highly sensitized recipients and other donor and ICU parameters did not have a significant effect on long-term graft survival after the first year.
Risk factors for DGF
In view of the importance of DGF, possible predictors of this state were investigated.
DGF was found to be significantly influenced by CIT, donor age and donor creatinine (Table 4). CIT, donor age and donor serum creatinine were entered into the statistical model as continuous variables. The statistical analysis indicated that an increase in each of these variables independently increased the risk of DGF. Hence, an increase in each unit of the variable, each hour of CIT, year of donor age and micromoles per litre of donor serum creatinine increased the incidence of DGF.
The only other factor that increased significantly the risk of DGF was transplantation of a female kidney into a male recipient (P<0.005), which independently conferred a higher risk of DGF than a female kidney into a female recipient or a male kidney into either sex (Table 4).
No evidence was found for departures from the logistic model. The ‘Hosmer–Lemeshow’ goodness of fit statistic was not significant. Addition of quadratic terms in donor age and CIT did not improve the fit, nor did replacement of CIT by its logarithm. Banded results for donor age and CIT are shown in Table 6.
DGF by bands of CIT and donor age
| Number | % DGF | |
|---|---|---|
| CIT (h) | ||
| 5–17 | 124 | 22 |
| 18–20 | 91 | 21 |
| 21–24 | 106 | 25.5 |
| 25–31 | 88 | 35 |
| 32–70 | 91 | 50 |
| Donor age (years) | ||
| 7–27 | 102 | 15 |
| 28–38 | 107 | 22 |
| 39–47 | 98 | 36 |
| 48–56 | 96 | 37.5 |
| 57–80 | 97 | 41 |
| Number | % DGF | |
|---|---|---|
| CIT (h) | ||
| 5–17 | 124 | 22 |
| 18–20 | 91 | 21 |
| 21–24 | 106 | 25.5 |
| 25–31 | 88 | 35 |
| 32–70 | 91 | 50 |
| Donor age (years) | ||
| 7–27 | 102 | 15 |
| 28–38 | 107 | 22 |
| 39–47 | 98 | 36 |
| 48–56 | 96 | 37.5 |
| 57–80 | 97 | 41 |
However, the overall explanatory power of the model was not great, the Nagelkerke R2 was 0.196. In the ‘classification table’, most of the DGF occurred in those cases where it was not predicted (sensitivity 30%, specificity 93%).
Donor factors, such as death resulting from cardiovascular disease, prolonged donor ventilation time, requirement for inotropes and other factors associated with ICU management (as in Table 1) were not risk factors for DGF. Recipients who received a kidney from a donor who suffered a traumatic death had a significantly decreased risk of DGF but this was not significant after inclusion of the ‘female to male’ variable.
Risk factors for acute rejection
The most important predictors of rejection were the number of DR mismatches and the occurrence of DGF. However, there was evidence of an interaction between them with an effect of mismatches only in the absence of DGF (Figure 3), a test for interaction was significant (z = 2.44, P = 0.014). Donor age was also a significant factor; the relation appeared to be continuous. Overall results are presented in Table 4.
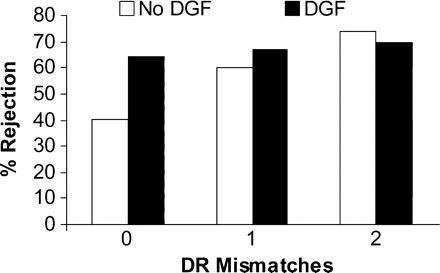
Effect of DGF and DR mismatches on rejection.
Recipients who received kidneys from donors requiring inotropes had a significantly higher risk of early rejection (P<0.05). AR was not more prevalent in highly sensitized patients, or patients with pre-transplant HLA antibodies. In addition, the analysis of early AR (within 14 days after the transplant) suggested that DGF and the degree of DR mismatching were still the most significant risk factors (P<0.05 and P<0.005). However, in this early period, unlike in the overall analysis, younger recipients did have an increased risk of developing early rejection (P<0.05). In contrast, in this early time period donor age was not a statistically significant variable (P>0.05).
Factors affecting 1 year creatinine
As creatinine at 1 year was a highly significant predictor of late failure, factors that might predict this were also investigated. Significant predictors were donor and recipient ages, and DGF (Table 7). The overall R2 was low (0.166), showing again that the model did not explain the variation fully.
Factors affecting 1 year creatinine
| Factor | Slope | P-value |
|---|---|---|
| DGF | 19.2 | 0.035 |
| Donor age | 1.83 | <0.005 |
| Recipient age | −0.89 | 0.004 |
| Factor | Slope | P-value |
|---|---|---|
| DGF | 19.2 | 0.035 |
| Donor age | 1.83 | <0.005 |
| Recipient age | −0.89 | 0.004 |
Factors affecting 1 year creatinine
| Factor | Slope | P-value |
|---|---|---|
| DGF | 19.2 | 0.035 |
| Donor age | 1.83 | <0.005 |
| Recipient age | −0.89 | 0.004 |
| Factor | Slope | P-value |
|---|---|---|
| DGF | 19.2 | 0.035 |
| Donor age | 1.83 | <0.005 |
| Recipient age | −0.89 | 0.004 |
Discussion
We have used multivariate analysis to investigate the influence of a number of factors, and the relations between them. A single-centre study permits the use of more detailed data in a fairly homogeneous set and provides a useful complement to multi-centre studies. We selected the decade of the 1990s for this study because in our unit this was a period of very uniform immunosuppression and clinical practice. These immunosuppression agents are still of great relevance today as the use of cyclosporine and azathioprine are still part of the UK national guidelines as laid down by the National Institute of Clinical Excellence. Similar studies published previously have often come from multi-centre registry data, where the level of HLA matching is variable, CITs are often longer and there are large variations in induction and maintenance regimens between centres [5,6]. Very few patients were excluded from this study, only then when there was a lack of donor information. The incidence of DGF, AR and the 1 year graft survival in these patients showed that this group was no different to the study population, suggesting that loss of these patients was unlikely to have distorted the results of the study.
DGF
The most striking effects found in our study are the strong impact of DGF and CIT, reduced importance of rejection and the lack of impact of matching. The importance of DGF and rejection for subsequent failure has been a matter of controversy for some time [7,8].
The lack of effect of matching on graft survival was not surprising. Recently, Su et al. [9] have reported a declining effect of matching in the USA during the period covered by our study. It is possible that improved immunosuppression, together with diagnosis and treatment of rejection, mean that in a relatively well-matched population such as ours these factors do not lead to failure (the mean total number of mismatches was 2.7, as against 3.6 in a recent multi-centre report [10]).
The incidence of DGF in our series at 31% was consistent with our previous data [11] and comparable to that of other centres [5,7,8]. CIT was the most significant risk factor for the development of DGF and its effect appears to be continuous. This observation is supported by other investigators [7]. Other studies have suggested that there are significant time points after which the risk of DGF accelerates [5,8,12]. The importance of the finding in this study needs to be stressed, as it is attractive to imagine a specific threshold CIT after which the risk of DGF is significantly increased. However, from our findings it is clear that each hour even at short CIT adds additional risk.
Recent multi-centre studies have confirmed the importance of cold ischaemia time and donor age for graft survival. Su et al. [9] show that the effect is significant for times over 37 h compared with baseline. However, they do not test for discontinuity and overall, their data appear consistent with a continuous effect of CIT. The Collaborative Transplant Study [10] suggests that there is ‘little effect below 25 h’; however, they do not present any analysis to confirm this, and it is not obvious from their figures. Roodnat et al. [13] previously reported effects on graft survival over a wide range of CIT. Our results differ from theirs in that Roodnat et al. found the effect to be limited to the short-term, whereas we find evidence of an effect of CIT on late failure.
Despite the large number of variables studied in relation to DGF, the fit of the statistical model is far from complete; indeed one advantage of the model is that it emphasizes this. The ‘Nagelkerke R2’ [3] is a generalization of the standard measure of fit of a multiple linear regression model, but caution should be exercized in interpreting it. However, taken together with the results of the classification table from the logistic regression, it suggests that other unknown factors are having an effect. It is possible that some organs are more sensitive (susceptible) to cold ischaemia, reperfusion injury and the vaso-constrictive effects of calcineurin inhibitors than others and the reason for this needs further investigation. We have not examined the effect of time on dialysis, which has been reported as a predictor in several studies [7]. In view of the evidence that DGF is a major predictor of graft failure, efforts should be made to understand better what is involved and how it may be reduced.
AR
The incidence of AR at 54% in this study may be considered to be high by contemporary standards. However, our data corresponds to therapy based on cyclosporine, azathioprine and steroids without routine use of antibody therapy. In our unit, rejection episodes were confirmed by core biopsy and protocol biopsies were carried out at day 7 and 28 post-transplant. Furthermore, fine-needle aspirations were performed routinely to monitor the level of infiltration in the graft in recipients with DGF. We have found as reported by Rush and colleagues [14], that sub-clinical rejection occurred but was not treated or included in the analysis as AR. The degrees of severity of rejection were not analysed individually as the study crossed over periods of significant changes in classification. However, ATG was used when severe rejection occurred and the use of ATG is not significant in multifactorial analysis.
DGF is also a significant risk factor for AR. It has been suggested that AR may be masked during DGF, as renal function cannot be used to detect episodes of AR [8]. Hence, treatable episodes of rejection may not be diagnosed and it is the failure to treat this occult rejection rather than the DGF itself that leads to a reduced long-term outcome. In our study, we believe, this difficulty in analysis has been avoided as all allografts are biopsied routinely and AR is diagnosed irrespective of function.
In the present study, the risk of AR was not increased in re-grafts nor in sensitized patients. Preformed donor-reactive anti-HLA antibodies are detected by modern cross-matching techniques and antibody screening was done to determine if antibody specificity is performed before the transplant. The thorough immunological work-up of transplant recipients has prevented the presence of antibodies from being a risk factor for rejection.
1 year graft survival
The main determinant of 1 year graft survival in this series, after censoring for death with a functioning graft, was DGF. There were no adverse effects of other donor factors including donor age or ICU management on 1 year graft survival. Importantly, no other factors were significant, including AR, HLA matching, highly sensitized recipients and re-grafts. The lack of an effect of AR on 1 year graft survival is surprising but not unexpected. This phenomenon has been mirrored in many recent publications comparing immunosuppressive regimens. It would suggest that AR in the first year is no longer a good endpoint for comparative studies [15]. Furthermore, highly sensitized recipients were treated with ATG as induction therapy which could account partly for the good results obtained on these patients as reports suggest that antibody therapy helps to prevent graft loss in these high-risk patients. However, this is not the full story as the variable ‘ATG on induction’ has no independent effect on survival.
The only other significant factor that influenced the 1 year graft survival was the year of transplantation. The immunosuppressive regimen and other factors over this period were unchanged which suggests that other factors not included in the statistical model had an impact on short-term graft survival (Sandimmune vs Neoral). It is possible that there were medical and technical improvements made over the study period that increased survival. In an observational study we cannot exclude the possibility of such confounding factors. However, changes over time do not explain the effect of DGF on survival because this is maintained in the proportional hazards analysis including ‘transplant year’, and in log-rank analysis stratified by ‘transplant year’.
Censoring for death is a well-known and common practice in the analysis of transplant outcome but this might have an unexpected effect on the analysis as it may selectively exclude patients with high serum creatinine. In a recent publication, Meier-Kriesche and colleagues [16] have reported a strong association between renal function at 1 year and the risk of cardiovascular disease and infectious mortality. According to this publication, a serum creatinine level of 1.9–2.1mg/dl conferred a 50% increased risk of cardiovascular death compared with a serum creatinine level of >1.3 mg/dl.
Long-term graft survival
The only factors affecting the long-term survival of those grafts that reached 1 year after censoring for death were recipient age and CIT and no apparent effect of AR or HLA matching. Crucially, we have found in our study that CIT affects long-term graft survival independently of the phenomenon of DGF. Other studies have found that DGF is one of the most important factors related to graft loss but have not identified CIT as having an impact in the long-term. In contrast, Ojo and colleagues [5] in a study from American registry data found that prolonged CIT directly and independently of DGF and AR, compromised the long-term graft survival. In our study, we have shown that the effect of CIT on long-term graft survival is linear and hence, there is no threshold below which CIT is acceptable or a threshold beyond which the deleterious affect of CIT accelerates.
We have not shown an influence of AR on graft survival after 1 year. Even though AR was common (54%), the incidence of severe rejections and steroid-resistant rejections were low. In contrast, it has been demonstrated in less well-matched populations using large retrospective databases that there is an impact of HLA-matching and the more severe forms of rejection on long-term graft survival.
Finally, the serum creatinine at 1 year, rather that the serum creatinine at 3 or 6 months, was found from this analysis to be an excellent predictor of the long-term survival of the graft as was reported by Hariharan [6]. It was also found to be an important factor in a recent report by He and Johnston [17].
In conclusion, the factors involved in the short and long-term outcome and function of the renal transplant graft are multiple and interrelated. Older donors with pre-existing medical conditions and more fragile donor organs will need to be used to bridge the gap between supply and demand for cadaveric organs. Even though this study has not shown a significant impact of donor management, it would still seem appropriate to study ways of minimizing harm to the donor organ during this period. Minimization of the injury during the period of preservation will have increased importance. At a local level our study lends weight to the need for sympathetic treatment of kidneys at multi-organ retrievals and access to theatres at the earliest possible opportunity. Our study has stimulated research into the cost-benefit ratios of increased use of the more expensive cold preservation solutions. Furthermore, the use of organ perfusion by machine at both cold and warm temperatures is now being revisited.
CIT is clearly identified as an important factor, and one that can be controlled. Efforts should therefore be made to reduce CIT as much as possible; indeed it was reduced during the period of this study. It would be unwise to place emphasis on ‘cut-off values’ that have not been rigorously demonstrated.
HLA matching has been the major focus of national and local sharing schemes to improve outcomes from transplantation. Although sharing could result in an increased in CIT, this has usually been seen as a price worth paying for improved matching. Recent national data shows that the CIT of shared kidneys is only slightly longer than that of local kidneys (UK Transplant, Bristol). We do not propose that attention to HLA matching should be reduced but that practices could be reviewed with the objective of reducing CIT whilst maintaining matching.
Conflict of interest statement. None declared.
References
Marshall R, Ahsan N, Dhillon S, Holman M, Yang HC. Adverse effect of donor vasopressor support on immediate and one-year kidney allograft function.
Pratschke J, Wilhelm MJ, Laskowski I et al. Influence of donor brain death on chronic rejection of renal transplants in rats.
Nagelkerke N. A note on a general definition of the coefficient of determination.
Altman DG, Bland JM. Interaction revisited: the difference between two estimates.
Ojo AO, Wolfe RA, Held PJ, Port FK, Schmouder RL. Delayed graft function: risk factors and implications for renal allograft survival.
Hariharan S, McBride MA, Cherikh WS, Tolleris CB, Bresnahan BA, Johnson CP. Post-transplant renal function in the first year predicts long-term kidney transplant survival.
Kyllonen LE, Salmela KT, Eklund BH et al. Long-term results of 1047 cadaveric kidney transplantations with special emphasis on initial graft function and rejection.
Troppmann C, Gillingham KJ, Benedetti E et al. Delayed graft function, acute rejection, and outcome after cadaver renal transplantation. The multivariate analysis.
Su X, Zenios SA, Chakkera H, Milford EL, Chertow GM. Diminishing significance of HLA matching in kidney transplantation.
McLaren AJ, Jassem W, Gray DW, Fuggle SV, Welsh KI, Morris PJ. Delayed graft function: risk factors and the relative effects of early function and acute rejection on long-term survival in cadaveric renal transplantation.
Boom H, Mallat MJ, de Fijter JW, Zwinderman AH, Paul LC. Delayed graft function influences renal function, but not survival.
Roodnat JI, Mulder PG, van Riemsdijk IC, IJzermars JN, van Gelder T, Weimar W. Ischemia times and donor serum creatinine in relation to renal graft failure.
Rush DN, Karpinski ME, Nickerson P, Dancea S, Birk P, Jeffery JR. Does subclinical rejection contribute to chronic rejection in renal transplant patients?
Paraskevas S, Kandaswamy R, Humar A et al. Predicting long-term kidney graft survival: can new trials be performed?
Meier-Kriesche H, Baliga R, Kaplan B. Decreased renal function is a strong risk factor for cardiovascular death after renal transplantation.
Author notes
1Nuffield Department of Surgery, John Radcliffe Hospital, Oxford, OX3 9DU, UK and 2Oxford Transplant Centre, Churchill Hospital, Oxford, OX3 7LJ, UK


Comments