


Abstract
Objectives: We documented the following components of waiting time for total hip replacement (THR): first surgical consultation, date of decision to operate and date of surgery. We then explored whether these intervals differed by age, sex, occupation or quality-of-life score.
Methods: We used a cross-sectional design and collected the primary data from patients 2 to 4 weeks before they underwent THR. Trained interviewers administered the Medical Outcomes Study Short Form-36 and the Western Ontario and McMaster Universities Osteoarthritis Index (WOMAC), which included data on event dates, conservative treatment, demographic information and quality of life. We illustrated waiting times, quality of life and past use of conservative treatment (i.e., cane, exercise, physiotherapy) with descriptive statistics (mean [standard deviation] or median [intraquartile range]) for continuous variables and with percentages for categorical variables. We plotted Kaplan–Meier graphs for each waiting time component and employed log-rank analysis to determine whether any of these delays differed by age, sex, occupation or disability. We also performed a Cox regression to adjust for all covariates simultaneously.
Results: The median wait from surgical consultation to decision to operate was 0 months. There was no difference between age, sex or occupation. The median wait from decision to operate to the date of surgery was 6 months and did not differ by age, sex or occupation. However, subjects with more severe symptoms (WOMAC) underwent surgery earlier than did those with less severe disease.
Conclusion: Although neither of the waiting time components were associated with age, sex or occupation, patients with more severe symptoms appear to be prioritized for surgery.
Total hip replacement (THR) is a highly successful and frequently employed method for restoring function to people affected by osteoarthritis (OA). In Québec, the average annual rate of THR in 1995–1999 was 4.7 per 10 000, and 80.4% of these patients were diagnosed with OA.1 Unfortunately, patients needing elective THR in our publicly funded health care system often wait because resources do not match demand.2 One survey indicates that the median waiting time across Canada is approximately 6 months,3 with some patients waiting 1 year or longer. These delays for surgery prompted a recent lawsuit filed against the Québec government, where the court decided that the Québec government cannot prevent people from paying for private insurance for health care procedures covered under the current Canadian public health care system.
There are numerous findings of human and economic costs to society as a result of waiting for THR.3–7 Performing the surgery later in the natural history of functional decline has been associated with worse outcomes.8,9 Delayed access to orthopedic care compromises the health and quality of life of thousands of Canadians, in addition to being a strain on their families and caregivers.7
Waiting for THR has received a lot of attention in the media and by health policy makers; however, little is known about how patients are prioritized for surgery. For instance, we do not know whether queue order is based solely on clinical findings or whether personal factors such as occupation are considered. Also, the time that elapses before deciding to undergo surgery is rarely described.
The objectives of this study are to document 2 components of waiting time for people with hip OA who are on a waiting list and about to undergo THR in Quebec. We also explored whether these times differ by age, sex, occupation and, for the second timeline only, disease-specific quality-of-life score (Western Ontario and McMaster Universities Osteoarthritis Index [WOMAC]). We define the 2 periods as 1) surgical consultation to the decision to operate and 2) decision to operate to the date of surgery. Analyses for the first timeline are presented as exploratory only and should be interpreted cautiously, because we only had access to the operating surgeons’ charts and because patients could have had previous surgical consultations without our knowledge.
Methods
Study sample
We invited patients with OA who were scheduled to undergo first THR surgery in 1 of 5 tertiary care hospitals in Québec to participate in this study and to be interviewed at their preoperative evaluation. We excluded those who were under-going a revision of a previous surgery as well as those who could not speak English or French.
Procedure
We identified all patients from the offices of the collaborating orthopedic surgeons at the time that the surgery was scheduled. Participants who signed the informed consent form were contacted by a trained interviewer 2 to 4 weeks before their operation. The ethics committee of each participating institution approved the study.
The interview comprised several questionnaires. The first section included a survey used in a pilot project involving 39 patients with low back pain.10 It addressed when a surgeon was first consulted and when the decision to operate was made. The date of decision to operate was verified for a subsample of patients from 2 of the participating institutions by comparing the date that patients reportedly made the decision to operate with the documented date entered in the medical charts by the surgeon. Other information obtained from this questionnaire included aspects of previous nonpharmacological treatment (physiotherapy, use of a cane, exercise); how long patients would consider it reasonable to wait for surgery; and work history, which was categorized as manual (e.g., dressmaker, machinist), nonmanual (accountant, teacher) or mixed (involving both manual and nonmanual components, such as nursing).11
The second questionnaire was the Medical Outcomes Study Short Form-36 (SF-36). The SF-36 is a generic measure of quality of life9 with excellent psychometric qualities. 12–15 Its 8 subscales have scores ranging from 0 (worst) to 100 (best) and assess various components of health-related quality of life.
We also administered the WOMAC for the hip and knee. This multidimensional questionnaire has 3 subscales that measure Pain, Stiffness and Physical Function; each subscale score is normalized to a score from 0 to 100, with a higher count representing a lower function, worse pain or more stiffness.16–18 Both English and French Canadian versions of the SF-36 and the WOMAC are valid and reliable.9,19,20
Analysis
We used descriptive statistics (mean and standard deviation [SD] or median intraquartile range [IQR] for continuous variables, and percentages and standard error [SE] of the proportion for categorical variables) to illustrate waiting times, quality of life, and past use of physiotherapy, cane and exercise. Quality-of-life scores were compared with norm-based scores, using age-appropriate values.
We plotted Kaplan–Meier graphs for each waiting time component and employed log-rank analysis to determine whether these delays differ based on age, sex or occupation. For the decision to operate until the date of surgery timeline, we also included disease severity (based on WOMAC scores). We used Cox regression to adjust for the variables simultaneously and reported the hazard ratio (HR). We categorized total WOMAC scores into tertiles. Scores of less than 58 are recoded as lowest tertile and scores between 58 and 69 are classified as middle tertile. Scores of 70 or more represent those with the highest tertile. Research has demonstrated that there is little change in function over a wait period of 6 months,21,22 thus the WOMAC score obtained preoperatively is considered an appropriate estimate for the last time period.
Results
Demographic data
Of the 164 patients approached by the interviewers, all agreed to participate in the telephone interview. Three of the eligible candidates could not be contacted before their surgery, leaving 161 subjects to participate in the study. Most (139/161) of the participants were from 2 of the 5 participating hospitals (73 from one and 66 from another), whereas the remaining 22 were from the 3 other facilities. General demographic data are summarized in Table 1. The mean age was 68.7 years (SD 10.1 yr), with men being slightly older (69.4 [SD 9.7] v. 67.4 [SD 10.7] yr). Of the 161 participants, 59 (36.6%) were men. When categorized by age group (aged < 65, 65–79 and ≥ 80 yr), the ratio of men to women was similar in all 3 groups. All of the men and 81 (79.4%) of the women reported having been employed at least once. Counting housework as nonmanual labour, there were 32 in manual jobs, 91 in nonmanual jobs and 37 in “mixed” jobs11; one man did not answer the question. Only 45/161 (28.0%) reported having received physiotherapy treatments. As many as 123 (76.4%) said they had been told to use a cane, and 101 of these 123 (82% [SE 3.5%]) complied. An additional 11 people used a cane without it being recommended, for a total of 112/161 (69.6% [SE 3.6%]) who used a cane overall.
Summary of participants’ questionnaire responses (n = 161)
Quality-of-life measures
We compared the WOMAC scores of our sample with scores for a healthy population aged over 55 years with no history of knee or hip pain.17 As illustrated in Table 1, our scores on the Pain, Stiffness and Physical Function subscales were considerably higher than normal, indicating a significant level of impairment and disability in our sample.
Our sample’s scores on the SF-36 Physical Function, Role Physical and Body Pain subscales were significantly lower than the “normal” scores for the general American population aged 65 years and over, again indicating high levels of impairment and disability.
Waiting time
The total waiting time from the first surgical consultation to the date of surgery was divided into 2 intervals and was based on recall. We were not able to verify whether it was the patients’ first-ever surgical consultation, but we could ascertain that it was their initial consultation with the operating surgeon. Also, we were able to confirm the date of surgery (interview only done 1 to 2 weeks before surgery) and the date of decision to operate. When we compared the date of decision to operate on the questionnaire to the date recorded in the medical chart, 93.5% (130/139) of the participants’ responses were accurate to within 2 weeks (Fig. 1). We consider this to be an acceptable degree of precision because we asked only the month (we used the 15th day of the month for comparison) and year. The few (n = 9) outliers were examined more closely. In 6 of the 9 cases, the date the patients reported was the date surgery had been discussed with their surgeon or referring specialist, but evidently their name had not been placed on the waiting list at that time. Only 3 of the 139 (2.2%) dates verified were erroneous due to poor patient recollection. We verified that these outliers did not significantly affect our results, by reanalyzing the data with only the validated decision to operate dates.

Comparison of the date patients reported deciding to have total hip replacement (X axis) and the true date of decision to operate from the medical chart. Data are from the 2 institutions where most (86.3%) of the participants had surgery.
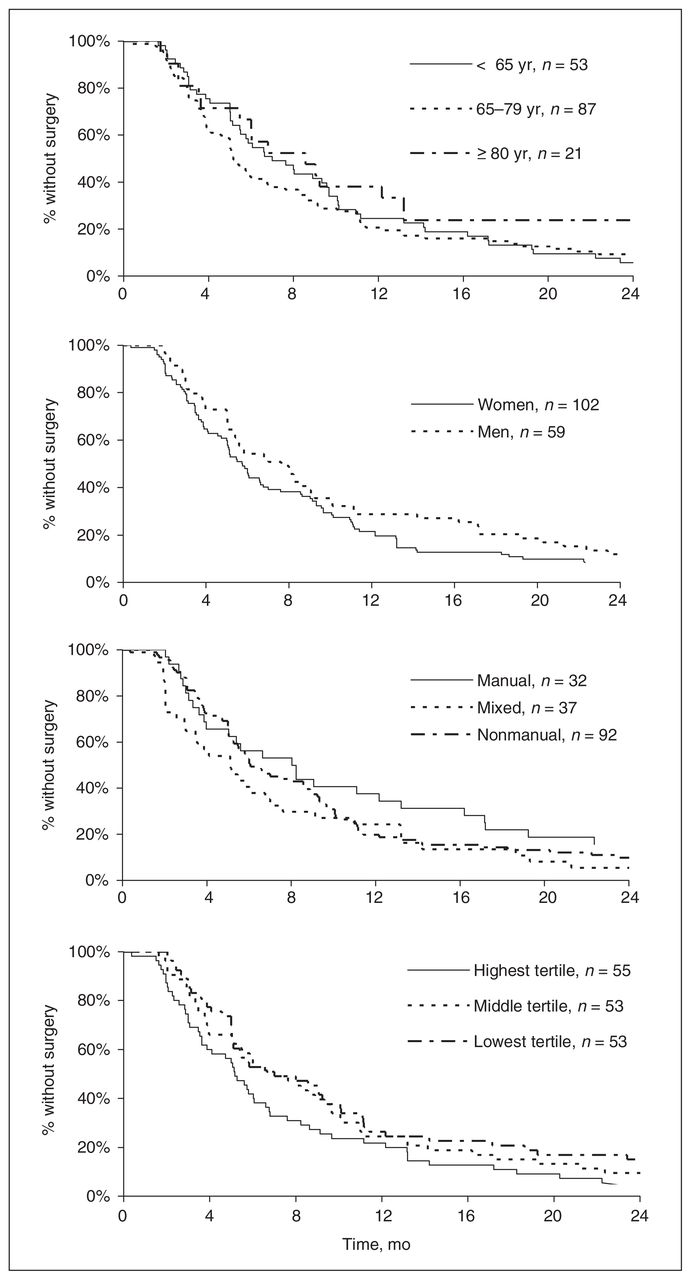
Kaplan–Meier survival analyses for each of the 2 intervals are shown in Figure 2 and Figure 3. The median wait for each of these timelines was 0 months (IQR 4.1) and 6 months (IQR 7.8), respectively.

Kaplan–Meier curves depicting time-to-event over 5 years from surgical consultation to decision to operate for subgroups divided according to sex, age and occupation.
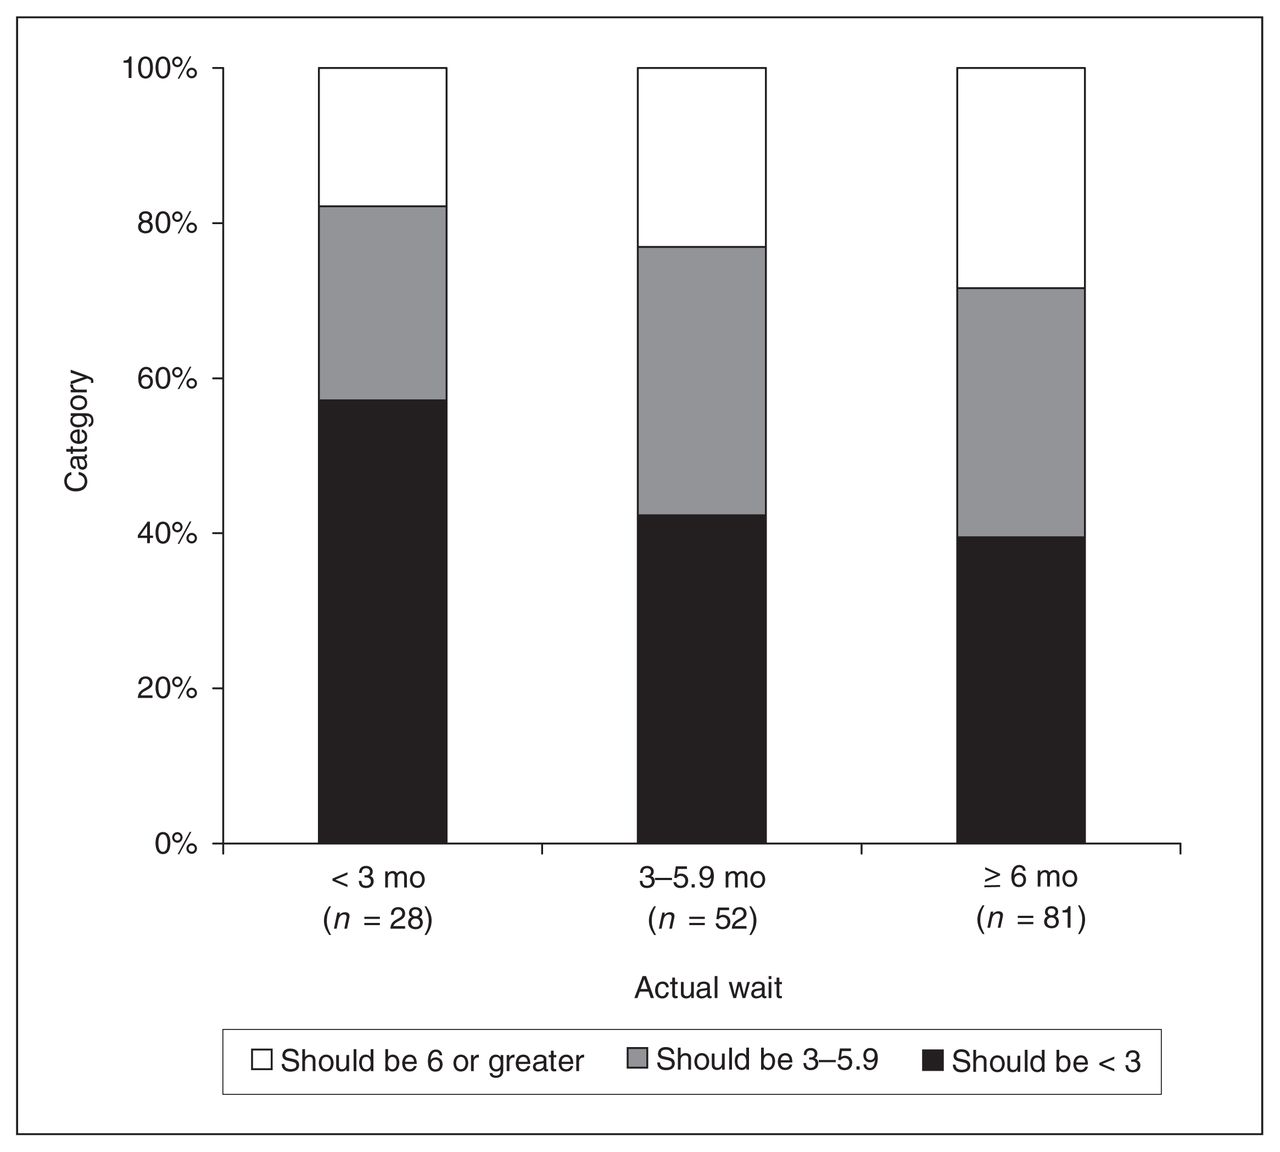
Subjects were grouped by actual wait from surgical consultation to date of surgery (i.e., 28 subjects waited < 3 mo from consultation to surgery). Within each group, subjects were categorized according to what they consider a reasonable wait. Reasonable wait categories were similar across groups.
Most (65.8%) of the participants recalled deciding to have surgery at the time of their first surgical consultation (Fig. 2). At 1 year from their first visit with the surgeon, more than 80% of all participants decided to have the operation. There was little change in the time-to-event curve beyond the first 12 months. In the univariate analysis, delay from surgical consultation until decision to operate did not differ based on age (p = 0.99), sex (p = 0.71) or occupation (p = 0.22). Results from the Cox regression were similar (data not shown).
As seen in Figure 4, about 80% of our participants had their surgery within a year of their decision to be operated on, and the median wait from decision to operate to date of surgery was 6 months. There were no significant differences between age (p = 0.42), sex (p = 0.12) or occupation (p = 0.27) in either the univariate analysis or the Cox regression. However, there was a significant difference between groups according to WOMAC scores in the univariate analysis, with patients with severe symptoms (highest tertile) being operated on earlier than those in the middle tertile, who in turn were operated on earlier than those with milder symptoms (lowest tertile) (p = 0.03). Similar results were obtained from the Cox regression model; patients with the most severe symptoms were more likely to have surgery sooner than those with the least severe symptoms (HR 1.6; 95% confidence interval [CI], 1.1–2.5]), and those with moderate symptoms were also more likely to be operated on before patients with the least severe symptoms (HR 1.4; 95% CI, 0.9–2.2). Finally, results were unchanged when we used the date of decision to operate documented by the surgeons rather than the date reported by the patient (data not shown).
Kaplan–Meier curves depicting time-to-event over 2 years, from the decision to operate to the date of surgery. Subgroups divided according to sex, age and occupation, as well as Western Ontario and McMaster Osteoarthritis Index Physical Function subscale score.
Perception of reasonable versus actual waiting times
When we asked the patients how long they felt was reasonable to wait for THR once the decision to operate was made, 43.5% said it was unreasonable to wait more than 3 months, and 31.7% said it was unreasonable to wait more than 6 months. The median waiting time patients considered reasonable was 12 weeks (IQR 17.5, range 0–56 wk, n = 161).
We also analyzed whether the actual waiting time for surgery affected the patients’ perception of what would be considered a reasonable wait. Figure 4 indicates that there were no clinically relevant differences between groups divided according to actual time waited. For instance, 57.1% (SD 12.4%) (n = 16) of people who waited less than 3 months and 39.5% (SD 8.6%) (n = 32) of those who waited 6 months or more said that 3 months or less is a reasonable wait. When the waiting time of each individual was compared with their opinion of a reasonable wait, 82.6% of the study participants waited longer than they felt was reasonable.
Discussion
Our findings reveal no difference in the delay from surgical consultation to decision to operate between age, sex or occupation. Once the decision to operate was made, the delay until surgery did not differ between age, sex or occupation; however, those with more severe symptoms underwent surgery earlier than did those with less severe symptoms.
There were some limitations to our study. First, our findings are applicable only to people with OA who went on to have THR. We did not track patients who were placed on waiting lists but did not have surgery. Second, although there is a possibility of confounding by institution, descriptive statistics of the patients from the 2 major institutions involved in the study did not differ significantly. Third, there is the potential for recall bias because we did not have access to recorded values to verify the history of physiotherapy intervention, exercise program or use of a cane. However, a pilot study that assessed the validity of recall of events surrounding past knee-replacement surgery concluded that the level of agreement between survey responses and the medical records was moderate to almost perfect for recall of events before knee replacement, such as prior surgery, use of medications, occupational status and living circumstances (weighted kappa 0.41–0.98).23,24
It is possible that the validity of patients’ recall of events, such as previous conservative treatment, is also satisfactory. We verified whether the reported dates for the decision to have surgery matched the recorded dates in the medical chart for 139 of our study participants. Only 6.5% of responses were inaccurate, and only 2.2% (n = 3) of patients reported an erroneous date due to poor recollection. Finally, we did not observe the patients prospectively through their wait, and we used the preoperative WOMAC scores to explore whether patients’ waiting times were affected by disease severity. Although there is evidence from cohort21,22 and cross-sectional8,25 studies that pain and dysfunction do not change during a 6-month wait for THR, there may be some effect when waiting time exceeds 6 months. Mahon and colleagues found extremely varied WOMAC scores for patients who waited over 12 months, with an unexplained improvement in function at 6 months.26 Kili and colleagues27 found that disability (according to the Harris Hip Score) increased with time; however, the slope of the regression line reported appears to be driven by the extreme waiting times of approximately 2000 days (5 ½ yr) for surgery, and there was no apparent relation between Harris Hip Score and a wait of up to 500 days.
Our sample resembled those described in previous studies on waiting for THR. We had a female majority at the time of surgery (63.4%), comparable to samples in other studies (range 57.4% to 71.8%).8,28–31 The average age in our sample (68.7 [SD 10.1] yr) was also consistent with that of previous studies.18,22,26,29 The WOMAC scores in our sample were very similar to those reported in the study by Mahon and colleagues26 and to the “low-function” group described by Fortin and colleagues.9 Although patients in the study by Hawker and others32 had higher function, they used a community-based sample that comprised all adults aged 55 years or over, regardless of OA severity.
In terms of the nonpharmacological interventions we considered, only 45 (28.0%) of the patients had received physiotherapy, despite that this intervention has been shown to be effective in the treatment of OA.33–36
We analyzed the time from first surgical consult until the decision to operate and the time from the decision to operate until the time the actual surgery occurred. Our exploratory analysis of the timeline from the date of first surgical consultation to the decision to operate shows that 65.8% of our participants decided to have THR at the time of their first consultation. This is comparable to Mahon and others, who reported a value of 57.2% (123/215).26 We delineated this analysis on the basis of age and found that almost 80% of the individuals in the group aged over 80 years decided the same day, compared with about 60% of those aged under 65 years. Deciding to have surgery on the day of the first consultation may indicate that people are being referred for surgical consultation only when surgery is indicated (i.e., appropriately) or that the condition was already severe enough to warrant surgery, and it is possible that they should have been referred earlier. The decision to operate might have been delayed in cases where patients were given other treatments by the surgeon before deciding to undergo surgery.
In the second timeline, from decision to operate until surgery, the median wait of 6 months (or 26 wk) was comparable with that reported elsewhere for arthroplasty of the hip, knee, ankle or shoulder in Québec (24.5 wk).37 Median waiting times were similar in Ontario (24.0 wk) and Manitoba (26.0 wk) and were slightly higher in Prince Edward Island (29.5 wk) and Alberta (32.0 wk). Patients in New Brunswick and Newfoundland had the shortest wait (16.0 wk), whereas those in Saskatchewan waited the longest (72.0 wk). British Columbia and Nova Scotia were tied for the second longest median waiting time, at 52 weeks.37
Waiting times from decision to operate until surgery differed with respect to symptom severity, but not age, sex or occupation. The Ontario Joint Replacement Registry (OJRR) reported similar findings with regard to waiting time according to sex (no difference between men and women), but their results regarding age group diverged from ours.38 The OJRR found that older patients did not wait as long for total joint replacements (n = 15 146) and suggested that this could relate to decreased health status and increased comorbidity in that age group.38
Regarding function, that patients with worse symptoms had surgery sooner suggests prioritization based on functional level. Several authors agree that if a health care intervention offers a reasonable probability of tangible benefit, it may be reasonable for those with the greatest need for the intervention to be served first, all else being equal.39–44 According to this philosophy, our study participants were appropriately prioritized for surgery, as were those of Mahon and colleagues.26 This is also consistent with waiting times in Ontario, where patients with the worst pain and function ratings (WOMAC) were operated on sooner.38 This was not the case in other studies,28,29,45 although one of those authors conceded that individuals with severe symptoms who were selected for immediate surgery might have been missed due to the cross-sectional design of their study.28
Priority for surgery may also be influenced by social factors such as socioeconomic status (SES). We obtained data regarding previous employment and considered our results in light of previous research on either SES or occupation and their influence on the waiting time for THR. Some studies have demonstrated that lower SES results in longer waiting times for THR,46,47 whereas other studies, like ours, found no relation between SES and length of wait.18 Because we used occupation as a proxy for SES, the middle (“mixed”) category might be expected to fall between the other groups. However, subjects in the mixed occupation category were operated on a little sooner than were those in the manual and nonmanual categories (Fig. 3). This discrepancy was not statistically significant and may be attributable to the types of occupations classified as mixed, such as homemakers and nurses. These occupations involve both manual and nonmanual tasks but do not necessarily reflect a midlevel SES. Also, of the 37 participants in the mixed group, 10 had previously worked as nurses. Their proximity to the health care system did not affect their wait-time, which was comparable with the overall average.
With respect to what patients consider a reasonable wait for surgery, our participants’ perception (median 12 wk) was not associated with the time they actually waited for surgery. Derrett and colleagues28 reported that 84% of people waiting for a hip or knee replacement wanted surgery within 6 months, with no apparent relation between wait-list priority and acceptable waiting time for surgery. A recent report by Esmail and Walker37 indicated that the median reasonable waiting time for orthopedic surgery, according to specialists, is 10 weeks and that, in 92% of cases, patients waited longer than they thought was reasonable. Our sample’s waiting experience was only slightly better, with 82.6% waiting longer than they thought reasonable.
In conclusion, the likelihood of increasing need for THR due to higher prevalence of hip OA in an aging population together with no increase in resources for such interventions make it extremely important to develop prioritizing strategies. Optimizing available resources for those who would benefit the most and who have the greatest needs would improve health services allocation to this population. Although not formalized, it is somewhat encouraging that functional status appears to be a criterion for THR prioritization.
Footnotes
This study was carried out in part with funding from the Fonds de Recherche en Santé du Québec and the Réseau provincial en adaptation-réadaptation.
Competing interests: None declared.
- Accepted June 21, 2005.
References
In this issue

Article tools


Related Articles
Cited By...
- No citing articles found.