


Abstract
Background: Demand for surgery to treat osteoarthritis (OA) of the hip, knee and spine has risen dramatically. Whereas total hip (THA) and total knee arthroplasty (TKA) have been widely accepted as cost-effective, spine surgeries (decompression, decompression with fusion) to treat degenerative conditions remain underfunded compared with other surgeries.
Methods: An incremental cost–utility analysis comparing decompression and decompression with fusion to THA and TKA, from the perspective of the provincial health insurance system, was based on an observational matched-cohort study of prospectively collected outcomes and retrospectively collected costs. Patient outcomes were measured using short-form (SF)-36 surveys over a 2-year follow-up period. Utility was modelled over the lifetime, and quality-adjusted life years (QALYs) were determined. We calculated the incremental cost per QALY gained by estimating mean incremental lifetime costs and QALYs of surgery compared with medical management of each diagnosis group after discounting costs and QALYs at 3%. Sensitivity analyses were also conducted.
Results: The lifetime incremental cost:utility ratios (ICURs) discounted at 3% were $5321 per QALY for THA, $11 275 per QALY for TKA, $2307 per QALY for spinal decompression and $7153 per QALY for spinal decompression with fusion. The sensitivity analyses did not alter the ranking of the lifetime ICURs.
Conclusion: In appropriately selected patients with leg-dominant symptoms secondary to focal lumbar spinal stenosis who have failed medical management, the lifetime ICUR for surgical treatment of lumbar spinal stenosis is similar to those of THA and TKA for the treatment of OA.
Osteoarthritis (OA) is the main cause of disability in the elderly population1 and has a major impact on functional capacity.2 The prevalence of this degenerative condition is increasing as Canada’s population ages.3 Consequently, the demand for surgical treatment of degenerative conditions of the hip, knee and spine has been on the rise.4–7 This trend has serious implications for the future use of health care resources and the health of Canada’s aging population.
Standard surgical treatment for symptomatic hip and knee OA consists of total hip (THA) and total knee arthroplasty (TKA), respectively. The surgical treatments for symptomatic lumbar spinal stenosis (LSS; with or without spondylolisthesis), a subset of the more generalized diagnosis of degenerative spinal OA, are decompression and decompression with fusion. Primary THA and TKA have proven to be the most effective treatments for hip and knee OA, respectively (once medical therapy has proven to be no longer effective), in terms of pain relief, improved functional status, quality of life (QoL) and overall patient satisfaction.8–10 Furthermore, primary THA and TKA, with a cost-effectiveness of $8031 per quality-adjusted life year (QALY) and $18 300 per QALY, respectively, have proven to be among the most cost-effective surgical interventions, both musculoskeletal and otherwise.11–13 Over the past decade, there has been increasing recognition and awareness of the challenges posed by the scarcity of health care resources against virtually unlimited health care needs and increasingly expensive treatment methods.14 As a result, decision-makers at all levels are under greater pressure to justify their resource allocation and priority-setting decisions. Specific to the surgical management of degenerative illnesses, issues of surgical wait time, budget impact, cost-effectiveness and utilization are an ongoing focus of health policy.4–7,15–21 Subsequently, societal demand combined with the cost-effectiveness and clinical effectiveness of THA and TKA have played a pivotal role in the widespread acceptance of these procedures by orthopedic surgeons and by governmental and nongovernmental funding agencies. Canada’s 10-Year Plan to Strengthen Health Care, the 2004 agreement between the Prime Minister and the provincial and territorial premiers, singled out THA and TKA as priorities in its wait time reduction strategy, granting volume-based funding for both surgeries.22
Surgical management of patients with symptomatic LSS (with or without spondylolisthesis) has not gained the same magnitude of support as THA and TKA despite substantial growth in lumbar spine surgery rates in the past 15 years.7 This is largely owing to the paucity of consistent findings in the literature demonstrating improved outcomes following elective surgical treatment of LSS and spondylolisthesis.23–25 However, a recent study by Rampersaud and colleagues26 demonstrated that improvement in patient QoL after surgery for LSS (with or without spondylolisthesis) was comparable to that after THA and TKA for OA after 2 years. In our current system, patients with LSS face considerable access challenges similar to those experienced by patients requiring THA and TKA.27,28
To our knowledge, there are no studies directly comparing the cost–utility of decompression and decompression with fusion to that of THA and TKA. The primary objective of the present economic evaluation was to address the paucity of spinal surgery literature to inform resource allocation and priority-setting decisions made by funding agencies. To do so, the lifetime incremental cost:utility ratios (ICURs) for decompression and decompression with fusion versus those for THA and TKA were compared.
Methods
Study design
From the perspective of the provincial health insurance system, we undertook a comparison of ICURs of elective surgery relative to failed medical management for treatment of hip and knee OA and LSS (with or without spondylolisthesis). This study was based on a single centre observational study of prospectively collected outcomes and retrospectively collected costs for matched cohorts of patients with hip and knee OA and those with LSS (with or without spondylolisthesis) who had failed medical management.
Incremental cost–utility analysis
Incremental cost:utility ratios compare 2 or more interventions by looking at the incremental cost and utility of one intervention over others, where cost is measured by monetary units and utility is measured by QALYs. We calculated the lifetime ICURs for treatment of hip and knee OA and LSS (with or without spondylolisthesis) by dividing the difference between the costs of surgery and medical management by the difference between their outcomes. The use of standard units (dollars and QALYs) enables the comparison between ICURs for the treatment of multiple conditions.
The primary outcome was the lifetime cost per QALY gained from surgery relative to failed medical management of hip and knee OA and LSS (with or without spondylolisthesis). The mean incremental lifetime costs and QALYs were estimated, discounting both costs and QALYs at an annual rate of 3%, as recommended by Drummond and colleagues.29 Additional discount rates, 0% and 5%, were included in the sensitivity analysis to assess the sensitivity of the results to discounting. Both future costs and utilities were discounted to adjust for society’s relative value placed on immediate costs and benefits compared with those in the future, a concept known as time preference. Commonly, resources in the present are preferred over future resources since benefit can be derived from present resources in the interim.29 Because both the medical management and surgical groups consisted of patients who had previously failed medical management and were eligible for surgery, the baseline QALYs of the medical management group were inferred from those measured in the surgical group. To estimate the incremental lifetime QALYs gained by the surgical group, the assumption was made that QALYs in the failed medical management group would not change from baseline in patients who chose to continue with conservative management. To calculate the incremental costs, we assumed that the only additional costs for surgery relative to medical management were perioperative costs, postdischarge rehabilitation costs and revision costs. We assumed all other costs to be equal and to occur at the same time in the surgical and medical management groups.
Patient population
As described in a study by Rampersaud and colleagues,26 the inception cohort was determined after treatment and independently selected from databases containing prospectively collected effectiveness measurements of patients who received THA and TKA for OA and patients who received decompression with or without fusion for LSS (with or without spondylolisthesis) at Toronto Western Hospital (TWH) over a 4-year period from January 2000 to December 2003. Patients with a diagnosis of LSS were initially divided into subgroups with and without spondylolisthesis. However, we then analyzed these subgroups as a single cohort after finding that there were no statistical differences with respect to the collected patient demographic characteristics and QoL scores at the preoperative and 2-year postoperative time intervals.26 Before receiving a surgical assessment, each patient had undergone at least 6 months of conservative care. Conservative care entailed typical care recommended by the referring physician: analgesia, formal and informal exercise, activity modification and assistive devices where applicable. At baseline, the average surgical wait time (time from decision to proceed with surgery to surgery) was 6–9 months for all 3 cohorts.
Inclusion criteria for LSS were intermittent neurogenic claudication resulting from 1- or 2-level spinal stenosis (i.e., focal lumbar spinal stenosis [FLSS]) with or without degenerative spondylolisthesis. Exclusion criteria for this group included other causes of spinal stenosis (congenital, post-traumatic, degenerative scoliosis), multilevel surgery, previous surgeries at the symptomatic or adjacent level, or multilevel coronal and/sagittal plane deformity. The surgical parameters for 1- and 2-level LSS (comorbidity and hospital stay) are similar to those for THA and TKA. In addition, they are the most common cause of surgery for LSS.
Patients in the THA and TKA groups had mechanical pain resulting from primary OA of the hip or knee. Exclusion criteria included secondary causes of OA (posttraumatic), inflammation and previous surgery other than knee arthroscopy.
The decision to offer/accept surgery was a shared decision between the treating surgeon and the patient. All consecutive patients who underwent surgery for LSS during the study period were assessed against the inclusion and exclusion criteria. Those who met the criteria were independently matched to larger cohorts of patients with hip and knee OA for age (within 2 yr), sex and date of surgery.
Surgery
Patients who failed medical management (standard care) for LSS (with or without spondylolisthesis) received either decompression alone or decompression with fusion. Midline, anatomy-preserving decompression was used for patients receiving decompression alone. This procedure was chosen for patients with leg-dominant symptoms (i.e., leg symptoms greater and/or more functionally significant than axial back symptoms thus the goal of surgery was to relieve leg symptoms) relieved by postural change/rest, those with no or tolerable mechanical back pain, those with anatomy favourable to facet-sparing (i.e., undercutting) decompression and those with no obvious dynamic instability with or without static spondylolisthesis (up to grade I). Decompression alone was performed as either inpatient or day surgery. Patients who had greater than grade I spondylolisthesis or dynamic instability demonstrated on supine-to-standing or flexion–extension imaging, those who had facet anatomy that precluded adequate decompression and those who had concomitant mechanical back pain resulting from 1- or 2-level disease that they felt was intolerable received decompression with fusion. Patients who underwent decompression with fusion had a formal laminectomy and segmental pedicle screw fixation with the use of iliac crest bone graft.
Uncemented THA was performed using the Harding (lateral) approach in patients who failed medical management for hip OA. Patients who failed medical management for knee OA received cemented TKA using a medial para-patellar approach. Surgeries performed on the same site for hip and knee OA were considered a revision. If a procedure was performed on the contralateral joint, it was not considered a revision. Spine revision was defined as same-site surgery and adjacent-site surgery.
Treatment effectiveness
Patients completed short-form (SF)-36 surveys both before surgery and 2 years postsurgery. We used the SF-6D index to convert these data into utility scores. Utilities were modelled over the first 2 years and through the lifetime, assuming the change was linear and remained constant at the 2-year levels. Utilities were plotted against time (years), and lifetime QALYs were determined as the area under the curve. We determined life years remaining for each treatment group using Statistics Canada’s age-specific life expectancy tables for Ontario.30 The outcomes of the medical management groups were inferred from the presurgery utilities of the surgery groups. They were assumed to remain constant at these levels throughout the lifetime.
Treatment cost
Average per-patient direct costs accrued by the provincial health insurance system (excluding out-of-pocket costs) were calculated by averaging the micro-costed values for all patients undergoing THA, TKA, spinal decompression and spinal decompression with fusion at TWH from January to December 2006. Cost data were obtained through the TWH financial department and inflated to 2009 values using the growth in nominal per capita total health expenditures, as reported in the most recent National Health Expenditure Trends report.31 Cost components for all treatment groups included operating room costs (central processing department, anesthesia, postanesthesia care unit), nursing (postoperative care unit and intensive care unit), medical imaging, laboratories, pharmacy and allied health. These costs exclude overhead (roughly equivalent among the 4 procedures); length of stay (LOS) outliers; and patients who died, transferred or signed out. Micro-costing data were not available at our institution until after 2004; consequently, costs were not determined using the patients for whom we had outcome data. Rather, the costs from all patients undergoing the same primary procedures in 2006 were averaged, and nursing, pharmacy and allied health costs were adjusted for the LOS of our cohorts with outcome data.
Rehabilitation costs postdischarge for patients who had THA and TKA were determined based on a study by Mahomed and colleagues,32 who conducted a randomized controlled trial at TWH and North York General Hospital in 2006. It was assumed that 100% of patients who underwent THA and TKA entered postdischarge rehabilitation in either an inpatient or home-based setting. The discharge rate to inpatient rehabilitation facilities was about 40% in 2001/02.33 Based on the more recent results of the Total Joint Network project reported to the Ministry of Health (Dr. Nizar Mahomed, Total Joint Network, Toronto, Ont.: personal communication, 2010), we assumed a rate of 30% use of inpatient rehabilitation for THA and TKA patients when calculating the mean cost. This rate was varied in the sensitivity analysis.
We determined the cost of revision surgery using the previous costing data, adjusted for the length of stay in hospital after revision surgery in our cohorts. In addition, patients receiving a revision surgery for the spine received an additional lumbar magnetic resonance imaging (MRI) scan with contrast before surgery, whereas patients who had a revision for the hip or knee had a radiograph (the cost of a 1-time area specific series was used). These costs were determined using the Ontario Case Costing Initiative (OCCI),34 and thus did not include overhead. We determined the revision rate using the present study’s cohort. Mean per-patient revision costs reflect this revision rate.
Additional postdischarge public health care resources, such as primary care physician visits, follow-up visits with the surgeon and prescription drugs for patients older than 65 years were not included in this study. Because the present study’s perspective was limited to the provincial health insurance system, costs borne by the patient and costs owing to lost productivity were not determined.
All costs were adjusted to 2009 values using growth in per capita medical costs from 2006 to 2009. We calculated the inflation rate using the growth in nominal per capita total health expenditures, as reported in the National Health Expenditure Trends, 1975–2009 report published by the Canadian Institute for Health Information.31 Costs are reported in Canadian dollars.
Sensitivity analysis
We performed single and multi-way sensitivity analyses. Utility, cost of the primary surgery, cost of the revision surgery, revision rate, percent home-based versus inpatient rehabilitation and discount rate were altered for hip and knee OA treatment groups. Utility, cost of the primary surgery, cost of the revision surgery, revision rate and discount rate were altered for the spine treatment groups. We varied utility between the upper and lower limits of the 95% confidence intervals (CIs) for utility. The primary surgery cost excluded revision costs and was varied between 75% and 125% around the mean baseline cost. Similarly, the cost of revision surgery was varied between 75% and 125% around the mean baseline cost. This was done to reflect the possibility of a longer reoperation time and higher implant costs — data that were not available. Altering the revision rate was performed to reflect values reported in the literature. Annual postoperative revision rates for THA and TKA in Ontario have been reported to be 10.2% and 7.8%, respectively.35 The 2-year postoperative revision rates for patients receiving decompression for the primary diagnoses of stenosis and spondylolisthesis have been reported to be 16.8% and 28.0%, respectively,36 and those for patients undergoing decompression with fusion for the primary diagnoses of stenosis and spondylolisthesis have been reported to be 19.9% and 17.1%, respectively.34 Percent home-based rehabilitation was varied from 0% to 60%. For each group, the lifetime QALYs gained were determined by extending the 2-year postoperative utility through the lifetime, assuming that utility gained remained constant at the 2-year follow-up level. Best- and worst-case ICURs were calculated for each surgical procedure. The worst-case scenario ICUR was calculated using the following parameters: the lower limit of the 95% CI for utility, the mean primary surgery cost plus 25%, the mean revision surgery cost plus 25%, the upper range of revision rate, 60% inpatient rehabilitation for THA and TKA, and a 5% discount rate. The best-case scenario ICUR was calculated using the following parameters: the upper limit of the 95% CI for utility, the mean primary surgery cost minus 25%, the mean revision surgery cost minus 25%, the lower range of revision rate, 0% inpatient rehabilitation for THA and TKA, and a 0% discount rate.
Results
In all, 220 patients underwent spine surgery for LSS, 248 underwent THA for OA and 260 underwent TKA for OA. Of those who underwent LSS, 99 met our inclusion criteria and were matched for age (within 2 yr), sex and date of surgery with patients in the THA and TKA groups, leaving 99 patients for analysis in each group (Table 1). Of the spine surgery cohort, 72% received decompression alone, whereas the rest had decompression with fusion.
Demographic characteristics of patients who underwent focal lumbar spinal stenosis and total hip or knee arthroplasty for osteoarthritis*
The costs of surgery at 2 years using the parameters described previously with a 3% discount rate were $14 783 for THA, $14 350 for TKA, $3972 for spinal decompression and $15 543 for spinal decompression with fusion (Table 2). The 2-year utility gain of surgery over baseline was 0.193 (standard deviation [SD] 0.157) for THA, 0.093 (SD 0.150) for TKA, 0.124 (SD 0.128) for spinal decompression and 0.156 (SD 0.140) for spinal decompression with fusion (Table 3). The corresponding 2-year QALYs gained, discounted at 3%, for each procedure were 0.275 for THA, 0.132 for TKA, 0.177 for spinal decompression and 0.223 for spinal decompression with fusion. Modelling over the lifetime, the discounted QALYs gained were 2.778, 1.273, 1.721 and 2.173 for THA, TKA, spinal decompression and spinal decompression with fusion, respectively (Table 3).
Average baseline per patient costs of hip, knee and spine surgery in 2009 values*†
Average baseline utility, QALY,* revision rate and length of time to revision
As shown in Table 4, the ICURs (expressed in dollars per QALY) were calculated over the lifetime for each procedure using a 3% discount rate. The discount rate was applied to both health utility scores and revision costs. At 3% discounting, the ICUR per QALY was $5321 for THA, $11 275 for TKA, $2307 for spinal decompression and $7153 for spinal decompression with fusion. The overall spine ICUR was $3664 per QALY. Table 4 also summarizes the worst-and best-case ICUR values calculated; they varied between $27 534 per QALY for worst-case TKA and $953 per QALY for best-case spinal decompression.
Baseline, worst-case and best-case lifetime incremental cost:utility ratios for each cohort*
Figures 1 to 4 depict the sensitivity of each procedure’s ICUR to variation in utility, discount rate, the percent home-based versus inpatient rehabilitation, the percent receiving a revision, revision cost and cost of the primary surgery. All procedures were sensitive to changes in discount rate, primary surgery cost and changes in utility. No procedures, however, were sensitive to variation in revision cost, and all but spinal decompression were insensitive to variation in revision rate. The revision rate of spinal decompression varied by the largest margin, from 0% to 30%, resulting in an ICUR ranging from $2194 to $3010 per QALY.
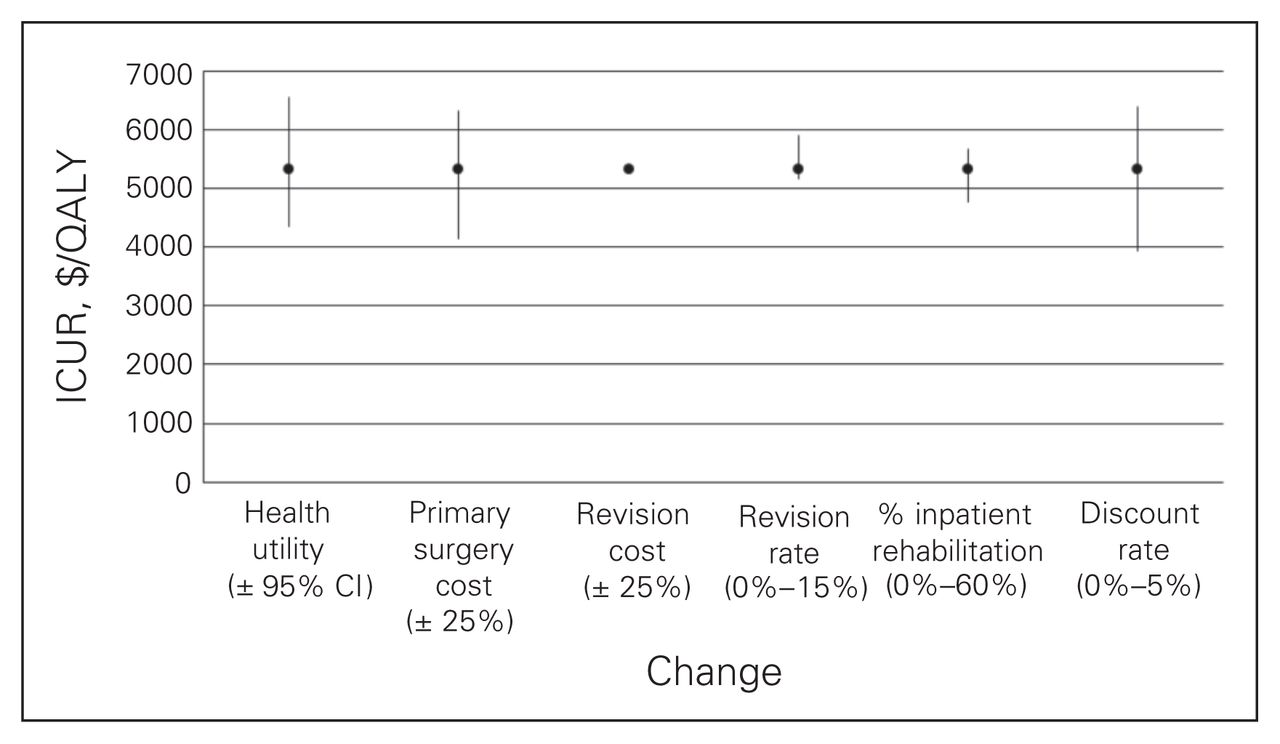
Sensitivity analysis for the total hip arthroplasty cohort. CI = confidence interval; ICUR = incremental cost:utility ratio.

Sensitivity analysis for the total knee arthroplasty cohort. CI = confidence interval; ICUR = incremental cost:utility ratio.
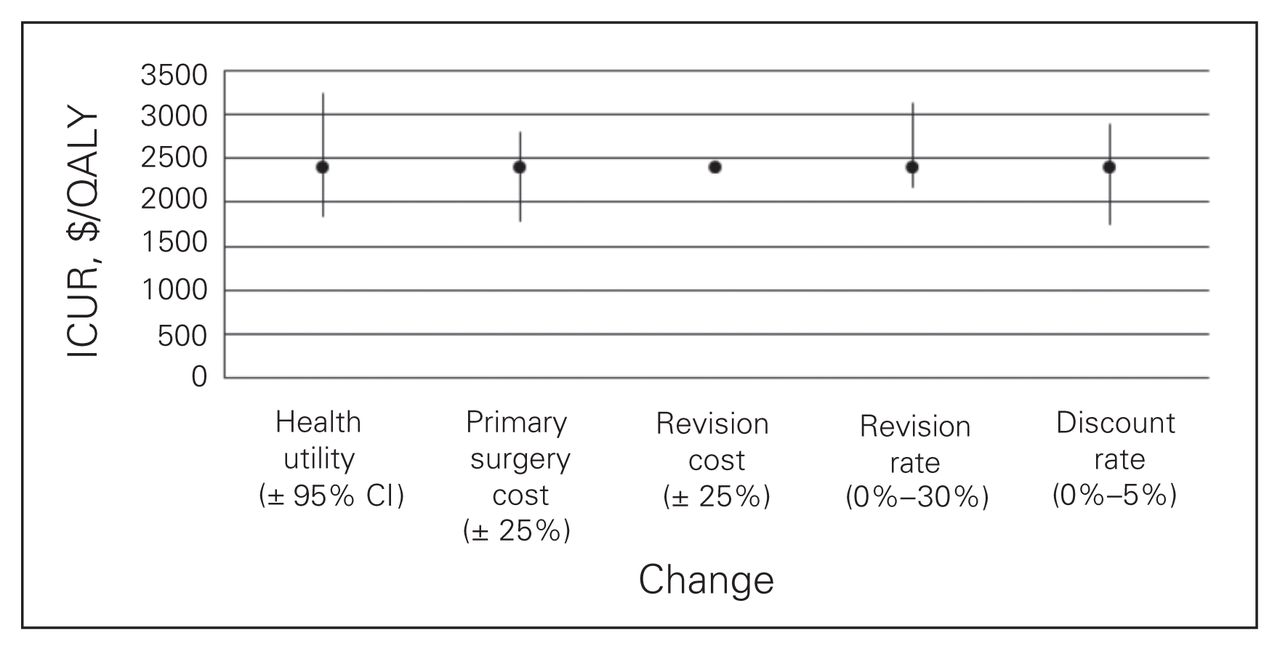
Sensitivity analysis for the spine decompression cohort. CI = confidence interval; ICUR = incremental cost:utility ratio.
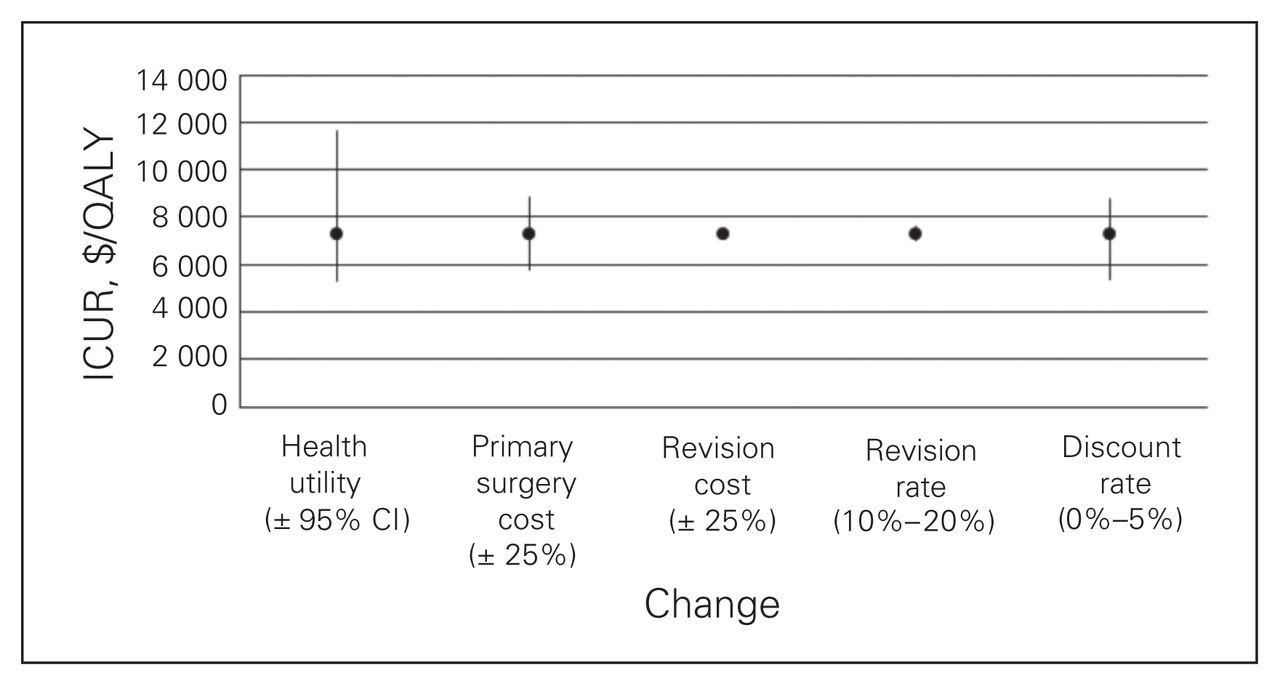
Sensitivity analysis for spine decompression with fusion cohort. CI = confidence interval; ICUR = incremental cost:utility ratio.
Discussion
To the best of the authors’ knowledge, this is the first study that compares 3 different orthopedic surgical procedures using matched cohorts and identical methods for outcome and cost collection for each procedure, an issue raised by Fritzell.37 The results of our study demonstrate that the lifetime ICURs of spinal decompression with fusion and spinal decompression alone for surgical treatment of LSS (with or without spondylolisthesis) are comparable to those of THA and TKA for surgical treatment of hip and knee OA. Although decompression alone was more favourable, results of decompression alone and decompression with fusion have been interpreted in combination to represent the perspective of overall end-stage surgical management of patients with leg-dominant symptoms secondary to FLSS (with and without degenerative spondylolisthesis) who failed medical management. In conjunction with other factors, such as relative patient demand and societal burden, these findings might suggest a similar approach to funding for spinal decompression and spinal decompression with fusion surgeries as with THA and TKA, such as volume funding, to try to improve the currently limited access to surgical care for this population. In addition, our study further validates the lifetime cost-effectiveness of THA and TKA.
The ICURs determined in this study are comparable (at similar time horizons) to those from other studies. The 2-year SPORT trial determined the mean ICUR (direct medical cost only) for spinal decompression with fusion for spinal stenosis without spondylolisthesis to be $70 900 per QALY38 using a limited time perspective of 2 years. If we applied the same time period to our data, the ICUR would be $69 689 per QALY. Chang and colleagues13 reported that the lifetime ICUR for THA was less than $10 000 per QALY. Losina and colleagues39 determined that the lifetime incremental cost per QALY for TKA was $18 700, but results were as low as $9700 per QALY. These are in line with the incremental cost per QALY reported in the present study, revealing that decompression has a lower ICUR than decompression with fusion for the treatment of LSS (with or without spondylolisthesis). This reflects the lower cost of decompression alone.
Our study has a number of strengths. In addition to being, to our knowledge, the first study to directly compare 3 orthopedic surgical procedures, it had matched cohorts and an excellent 2-year postsurgery response rate of 85%. Identical methods were used for outcome and cost collection for all patients. Furthermore, the study also used a prospectively collected, validated health-related QoL outcome measure converted to utility. The SF-6D is reported to have good responsiveness to the compared disease states and procedures evaluated in the present study;26 however, some studies have found lower QALY gains after spine surgery when estimated with SF-6D than with other outcome measures like the EuroQol (EQ)-5D.38 Although the comparison of ICURs between groups are valid, depending on regional cost differences and the chosen utility score, the absolute ICUR values found in our study may vary from those reported in other studies.
Limitations
This study has several limitations to consider when interpreting the results. Although patients were followed prospectively, this study is subject to the potential biases of a retrospective study because it did not have a prospective inception cohort.26 The outcomes of our medical management group were inferred, as these groups represent internally matched control groups who assume the role of the same patients without surgery. In addition, this study was performed at a single urban centre. Costs and outcomes may therefore not reflect all hospitals in Ontario. The costing data were collected using separate representative cohorts undergoing the same primary procedures. Thus, the costing data may not accurately reflect the cohort of patients used for outcome measurement. The costs of primary surgery for each diagnosis group were, however, slightly higher than the costs reported in the OCCI for all Ontario hospitals.34 Our study did not include overhead costs; however, based on similar care in the same institution and demographically matched cohorts, the overhead costs were likely similar for each of these procedures. Regardless, this was also assessed in the sensitivity analysis by adjusting the cost of the primary surgery. The overhead costs represent about 25% of the total costs of THA, TKA and spine surgeries according to the OCCI.34 Rough data from TWH revealed similar percentages. It was determined that the present study’s conclusion — that the cost effectiveness of spine surgery was comparable to 2 cost-effective orthopedic surgeries — remained true despite these overhead costs. Although our study did not consider indirect costs, it provided a more accurate perspective for guidance of resource allocation decisions by public funding agencies.
Cost components in this study included acute perioperative costs, postdischarge rehabilitation and revision costs. These costs account for the bulk of the direct costs related to surgical treatment of hip and knee primary OA40 and LSS (with or without spondylolisthesis).38 Additional postdischarge public health care resources, such as primary care physician visits and prescription drugs for patients older than 65 years, were not included in this study. In the absence of a patient-specific health care utilization diary, it would be difficult to distinguish between resources relating specifically to hip and knee OA and LSS (with or without spondylolisthesis) versus resources used for other diagnoses. The total costs to the provincial health insurance system reported in this study are thus underestimated. The incremental costs of surgery relative to medical management in this study are, however, overestimated because surgical patients use fewer OA-related health care resources after surgery, leading to cost savings.38,40 These savings are minimal in relation to the overall cost of treatment and will have little impact on the results. Furthermore, the relative incremental cost-effectiveness of hip, knee and spine treatments will vary slightly based on differences in cost savings but are not expected to impact the final conclusion. Indirect costs, such as lost productivity, will have a negligible impact on the results because the incremental indirect costs for this specific population are minor compared with the overall incremental costs.38
The cost of revision surgery was not available for this study but was instead determined by adjusting the mean cost of primary surgery by the difference in LOS after a revision. Additional cost factors, such as a longer operation time and more expensive implant for a revision, were not accounted for in the baseline ICUR calculations. These factors were assessed in the sensitivity analysis by varying the cost of revision surgery, but did not have a significant impact on the ICURs.
While it would be ideal to perform a health economic evaluation (HEE) in conjunction with a clinical trial and a priori economic data collection,38 most of the published HEE studies (at least for hip and knee replacements or spine surgery) present decision analytic models that are based on the literature, administrative databases and/or short-term cohort results rather than clinical trials.8,12,13,39,41–43 Furthermore, most have made many assumptions and forecasted the lifetime ICUR in a manner similar to those made in the present study. In addition, different values (e.g., QALYs, revision rates) are often assigned in the various reported models, and thus valid cross-comparisons within subgroups of a broader population are often not possible. As such, we feel that our study provides a more comprehensive assessment by directly applying the same methodology and context to all 3 cohorts. This provides a means by which a more direct comparison of the value of LSS surgery relative to the more familiar value of hip and knee replacements can be made. Regardless, an understanding of the assumptions made in any HEE is paramount to the interpretation of the results.
To determine the lifetime QALYs, we assumed that the utility of the surgical groups remained constant at the 2-year postintervention levels. In addition, we assumed that the utility of the medical management groups were constant at the baseline level throughout the life years remaining. Patients in this study had failed conservative treatment (no improvement in utility) and elected to have surgery. As has been demonstrated in wait-time studies in all 3 cohorts, the utility of the medical management group may continue to deteriorate over the lifetime.27,28,44 Correspondingly, the cost of medical management is likely to escalate over time, which has not been accounted for in this analysis.40,45,46 As a result, our incremental cost for each diagnosis group and consequently, the corresponding ICURs, are an overestimation. Also, the utility of the surgical groups are unlikely to remain static over the lifetime. The changes in utility over time may be different for hip, knee and spine patients. The relative cost-effectiveness differentials between hip, knee and spine treatment may therefore be impacted. Because the ICURs are an overestimation, however, our conclusions are unlikely to change significantly. Longer-term data would be required to better estimate lifetime changes in utility. Soegaard and Christensen43 reported that only 1 study has assessed the incremental cost-effectiveness of LSS surgery at 10 years (using a Markov model). Most effectiveness studies have had a follow-up duration of 2 years. Herkowitz and Kurz47 conducted a spine study with an average follow-up of 3 years; studies by Weinstein and colleagues48 and Atlas and colleagues49 had a follow-up of 4 years. The surgical outcomes of these 3 studies were generally similar and sustained.
In addition, the 2-year follow-up period of this study limited the time during which revision surgeries could be captured. The 4-year SPORT trial on spinal stenosis demonstrated an overall increase in the revision rate from 8% at 2 years to 13% at 4 years.50 The revision rate of the spondylolisthesis cohort of the SPORT trial increased from 12% at 2 years to 15% at 4 years.50 Similarly, Jansson and colleagues51 demonstrated an overall increase in revision rates for patients with spinal stenosis from 5% at 2 years to 11% at 10 years. Whereas these values are lower than the revision rates found in the present study (21.40% for decompression, 16.67% for decompression with fusion), study values are comparable to those found in another study with a more similar patient population with respect to disease group (i.e., inclusion of spondylolisthesis), with revision rates at 11 years of 18.8% for decompression surgery and 20.1% for decompression with fusion.36 To better compare the ICURs among the 3 diagnosis groups, the revision rate and rate at which utility is changing in the failed medical management and surgical groups for each diagnosis should be determined over a longer follow-up period. Nevertheless, the sensitivity analysis demonstrated minimal impact of revision rate on the lifetime ICUR.
Our study also did not separate patients with LSS diagnoses from those with spondylolisthesis. Tosteson and colleagues38 found that over 2 years, surgery for degenerative spondylolisthesis (95% of patients underwent a decompression with fusion) was not highly cost-effective ($115 600 per QALY gained). By contrast, they found that the economic value of surgery for spinal stenosis (decompression alone) compared favourably to other health interventions. In comparison, our spine cohort (LSS with or without spondylolisthesis) had similar utility outcomes to the cohorts used in the study by Tosteson.38 However, the gross difference in direct costs between the United States and Canada for fusion procedures (about double) and the limited time perspective of 2 years rather than the estimated lifetime gain in QALY used in our study accounted for the difference in cost-effectiveness findings in the 2 studies. As noted by Tosteson and colleagues38 and supported by our sensitivity analyses, sustained outcome over time will result in greater cost-effectiveness.
Conclusion
Our paper has demonstrated that when considering provincial health insurance costs, surgery for LSS (with or without spondylolisthesis) in patients who had failed conservative treatment results in comparable lifetime ICURs as THA and TKA, 2 cost-effective and widely accepted orthopedic surgeries. The study findings warrant further research and consideration by policy-makers and hospital administrators, among others involved in funding and research allocation decisions. Specifically, further research is required with a longer follow-up period to account for changes in revision rates and utility outcomes over time for all 3 cohorts. Such research will provide information on the long-term sustainability of hip, knee and spine surgeries from an economic perspective.
Acknowledgements
We thank Oma Persaud for her contribution in obtaining and preparing all participant data for statistical analysis. We are also grateful to Drs. Roderick Davey and Stephen J. Lewis whose patients are also included in our cohorts.
Footnotes
Competing interests: None declared for P. Tso, K. Walker and P.C. Coyte. N. Mahomed declares having received lecture fees from Smith & Nephew. Y.R. Rampersaud is a consultant for Medtronic.
Contributors: P. Tso, N. Mahomed, P.C. Coyte and Y.R. Rampersaud designed the study. Y.R. Rampersaud acquired the data. P. Tso, K. Walker, N. Mahomed, P.C. Coyte and Y.R. Rampersaud analyzed the data. P. Tso, K. Walker, P.C. Coyte and Y.R. Rampersaud wrote the article. P. Tso, N. Mahomed, P.C. Coyte and Y.R. Rampersaud reviewed the article. All authors approved its publication.
- Accepted November 7, 2011.
References
In this issue

Article tools


