


Article Figures & Tables
Figures
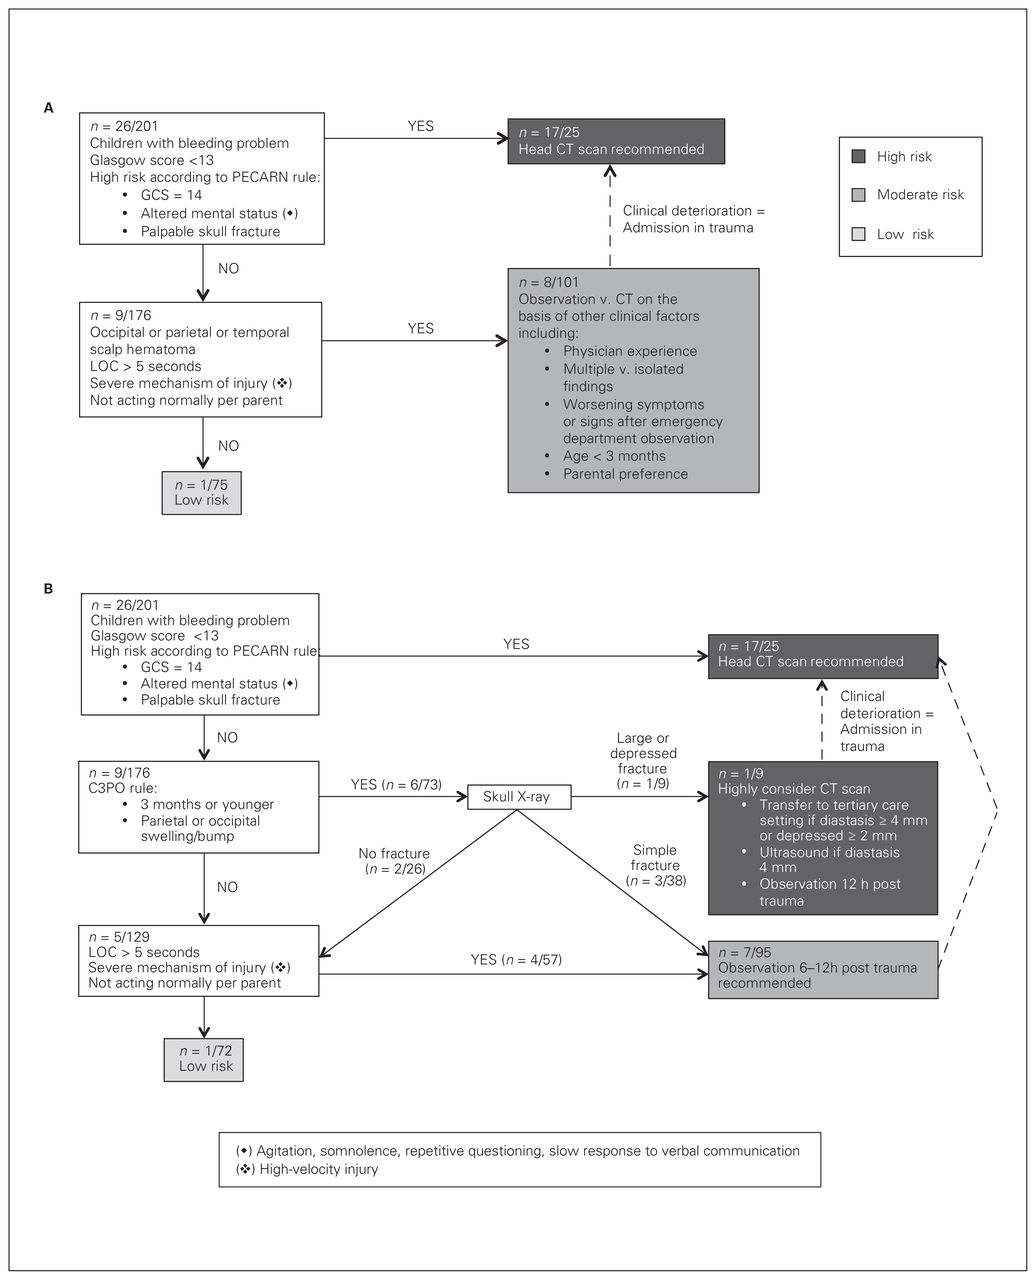
- Fig. 1
Distribution of the 201 participants according to (A) the Sainte-Justine Head Trauma Pathway and to (B) the Pediatric Emergency Care Applied Research Network (PECARN) Head Injury Prediction Rule. The numerators refer to the number of clinically important traumatic brain injuries (ciTBI). CT = computed tomography; GCS = Glasgow Coma Scale; LOC = loss of consciousness.
- Fig. 2
Distribution of the full population (extrapolated) according to (A) the Sainte-Justine Head Trauma Pathway and to (B) the Pediatric Emergency Care Applied Research Network (PECARN) Head Injury Prediction Rule. The numerators refer to the number of clinically important traumatic brain injuries (ciTBI). CT = computed tomography; GCS = Glasgow Coma Scale; LOC = loss of consciousness.


Tables
Characteristic Hospitalized, n = 101 Not hospitalized, n = 100 All not hospitalized, n = 2158 Age, mo, median (IQR) 6 (2–14) 10 (6–18) — Age group, mo, % 1–2 29 4 8 3–11 36 54 46 > 11 36 42 46 Male sex, % 64 63 — Falls, % Any fall 79 84 — From his/her height 8 19 — From 1–3 feet 46 48 — From > 3 feet 25 17 — Fall from arms of a parent 24 2 — Fall on the stairs 7 14 — Loss of consciousness, % 8 0 — Head CT scan, % — Not done 42 100 — Normal 8 — — Not normal 50 — — Skull radiograph, % — Not done 38 75 — Normal 13 25 — Not normal 50 — — Final disposition, % — Hospitalized 100 0 — Observation then home — 19 — Directly home — 81 — CT = computed tomography; IQR = interquartile range.
- Table 2
Accuracy in identification of patients using Sainte-Justine Pathway and PECARN rule
Variable Sainte-Justine Pathway PECARN rule High risk Moderate risk Low risk Total High risk Moderate risk Low risk Total Study sample ciTBI 18 7 1 26 17 8 1 26 No ciTBI 16 88 71 175 8 93 74 175 Total 34 95 72 201 25 101 75 201 Sensitivity (95% CI), % 96 (81–99) 96 (81–99) Specificity (95% CI), % 41 (33–48) 42 (35–50) Positive predictive value (95% CI), % 19 (17–22) 19 (17–22) Negative predictive value (95% CI), % 99 (91–100) 99 (91–100) Positive likelihood ratio (95% CI) 1.6 (1.4–1.9) 1.6 (1.4–1.9) Negative likelihood ratio (95% CI) 0.09 (0.01–0.65) 0.09 (0.01–0.65) All population ciTBI (% of risk category) 18 (0.33) 7 (0.01) 1 (0.0007) 26 17 (0.37) 8 (0.01) 1 (0.0007) 26 No ciTBI 37 746 1449 2232 29 834 1369 2232 Total 55 753 1450 2258 46 842 1370 2258 Sensitivity (95% CI), % 96 (80–100) 96 (80–100) Specificity (95% CI), % 65 (63–67) 61 (59–63) Positive predictive value (95% CI), % 3.0 (2.7–3.3) 2.8 (2.3–3.3) Negative predictive value (95% CI), % 99.9 (9.59–99.9) 99.9 (9.59–99.9) Positive likelihood ratio (95% CI) 2.7 (2.4–3.0) 2.5 (2.3–2.7) Negative likelihood ratio (95% CI) 0.06 (0.01–0.40) 0.06 (0.1–0.4) CI = confidence interval; ciTBI = clinically important traumatic brain injury; PECARN = Pediatric Emergency Care Applied Research Network.
In this issue

Article tools


Related Articles
Cited By...
- No citing articles found.