


Article Figures & Tables
Figures
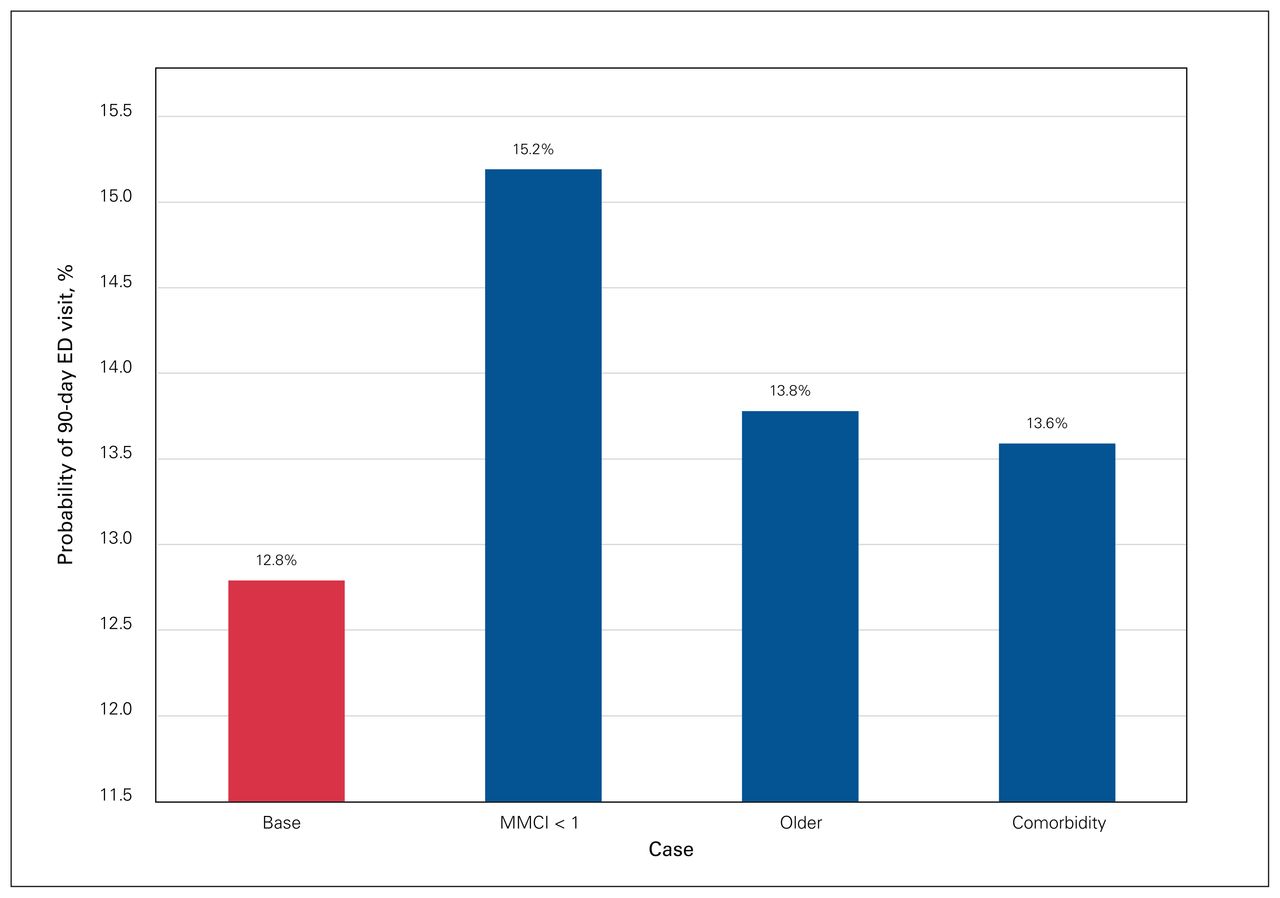
- Fig. 1
Comparison of predicted probabilities of a visit to the emergency department (ED) within 90 days of knee replacement surgery for the base case, the case without perfect continuity of care (Modified Modified Continuity Index score [MMCI] < 1), the older case and the case with a comorbidity. For the base case, all categorical variables were set at reference categories and continuous variables were set at means.
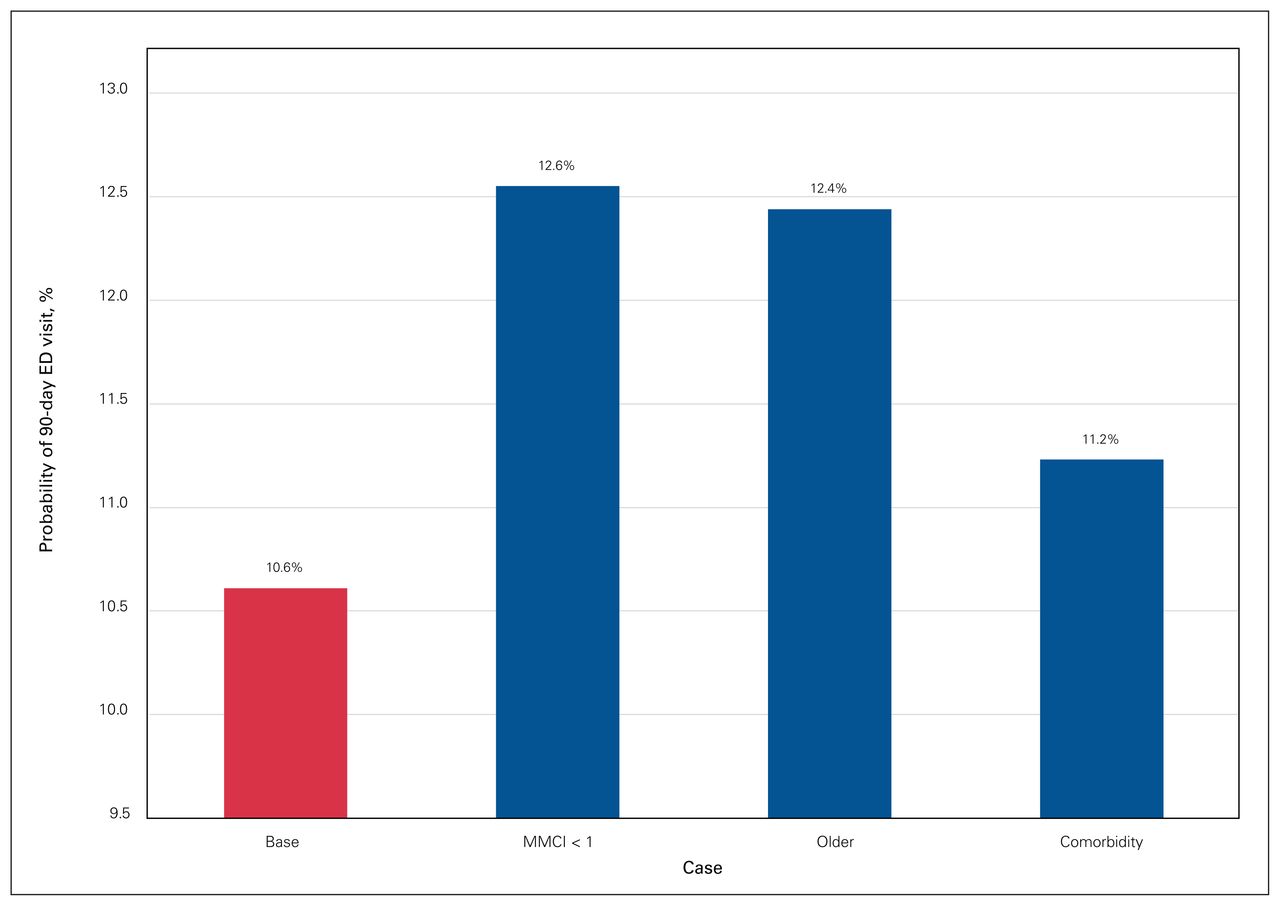
- Fig. 2
Comparison of predicted probabilities within 90 days of hip replacement surgery for the base case, the case without perfect continuity of care (Modified Modified Continuity Index score [MMCI] < 1), the older case and the case with a comorbidity. For the base case, all categorical variables were set at reference categories and continuous variables were set at means. ED = emergency department.
Tables
- Table 1
Association between emergency department visits following knee or hip replacement surgery and continuity of primary care
Variable Probability of an ED visit within 90 d of surgery Knee replacement surgery Hip replacement surgery Unadjusted OR (95% CI) Adjusted OR (95% CI) Unadjusted OR (95% CI) Adjusted OR (95% CI) MMCI × 100 0.987* (0.985–0.990) 0.994* (0.991–0.997) 0.991* (0.988–0.994) 0.994* (0.991–0.998) Length of stay, d – 1.020* (1.012–1.027) – 1.002 (0.998–1.007) Year of surgery – 1.025* (1.017–1.034) – 1.019* (1.007–1.030) Hospital C Ref. Ref. A – 1.072 (0.960–1.196) – 1.003 (0.870–1.158) B – 0.662* (0.594–0.739) – 0.835* (0.726–0.960) D – 1.001 (0.898–1.116) – 0.964 (0.814–1.142) E – 0.921 (0.833–1.019) – 0.787* (0.683–0.907) Age, yr 60–69 Ref. Ref. < 50 – 1.386* (1.124–1.709) – 0.949 (0.774–1.164) 50–59 – 1.043 (0.945–1.151) – 0.894 (0.778–1.028) 70–84 – 1.099* (1.015–1.189) – 1.208* (1.081–1.349) ≥ 85 – 1.439* (1.164–1.778) – 1.303* (1.103–1.649) Female – 0.950 (0.886–1.019) – 0.879* (0.801–0.965) Charlson Comorbidity Index score – 1.078* (1.031–1.126) – 1.069* (1.019–1.121) Hypertension – 1.024 (0.954–1.099) – 1.017 (0.923–1.120) Anemia – 1.131* (1.029–1.242) – 1.156* (1.020–1.309) Median neighbourhood income – 1.002* (1.000–1.004) – 1.000 (0.998–1.002) Blood transfusion – 1.260* (1.075–1.477) – 1.263* (1.074–1.487) Admitted from home – 0.758 (0.540–1.066) – 0.868 (0.627–1.203) Distance to hospital – 0.998* (0.998–0.999) – 0.999* (0.998–1.000) ED visit 1 yr earlier – 2.436* (2.263–2.623) – 2.008* (1.817–2.220) Note: The full range of MMCI values is included. CI = confidence interval; ED = emergency department; MMCI = Modified Modified Continuity Index; OR = odds ratio; Ref. = reference category.
↵* Statistically significant value.
- Table 2
Association between emergency department visits following knee or hip replacement surgery and perfect continuity of primary care (1 primary care provider)
Variable Probability of an ED visit within 90 d of surgery Knee replacement surgery Hip replacement surgery Unadjusted OR (95% CI) Adjusted OR (95% CI) Unadjusted OR (95% CI) Adjusted OR (95% CI) MMCI = 1 (1 primary care provider) 0.615* (0.542–697) 0.819* (0.720–0.933) 0.655* (0.563–0.761) 0.827* (0.708–0.966) Length of stay, d – 1.020* (1.012–1.027) – 1.002 (0.998–1.007) Year of surgery – 1.027* (1.019–1.036) – 1.020* (1.009–1.032) Hospital C Ref. Ref. A – 1.064 (0.953–1.187) – 1.002 (0.868–1.156) B – 0.660* (0.592–0.737) – 0.833* (0.724–0.958) D – 1.001 (0.898–1.116) – 0.965 (0.815–1.143) E – 0.919* (0.831–1.016) – 0.787* (0.683–0.907) Age, yr 60–69 Ref. Ref. < 50 – 1.408* (1.143–1.735) – 0.981 (0.802–1.201) 50–59 – 1.048 (0.950–1.157) – 0.902 (0.785–1.036) 70–84 – 1.089* (1.006–1.179) – 1.196* (1.072–1.336) ≥ 85 – 1.423* (1.152–1.758) – 1.294* (1.023–1.638) Female – 0.946* (0.882–1.015) – 0.873* (0.795–0.959) Charlson Comorbidity Index score – 1.072* (1.026–1.121) – 1.066* (1.016–1.118) Hypertension – 1.009 (0.941–1.083) – 1.000 (0.908–1.100) Anemia – 1.122* (1.021–1.232) – 1.146 (1.012–1.299) Median neighbourhood income – 1.002* (1.000–1.004) – 1.000 (0.998–1.002) Blood transfusion – 1.265* (1.079–1.483) – 1.263* (1.073–1.486) Admitted from home – 0.763 (0.543–1.072) – 0.877 (0.633–1.214) Distance to hospital – 0.998* (0.998–0.999) – 0.999* (0.998–1.000) ED visit 1 year earlier – 2.454* (2.280–2.641) – 2.015* (1.822–2.2.283) Note: For the analyses in this table, MMCI = 1. CI = confidence interval; ED = emergency department; MMCI = Modified Modified Continuity Index; OR = odds ratio; Ref. = reference category.
↵* Statistically significant value.
In this issue

Article tools


Related Articles
Cited By...
- No citing articles found.