


Abstract
Objective: To rank 39 surgical procedures in order of variation of inpatient surgical rates, according to a new index of variation and to test the hypothesis that there is greater variation for primarily discretionary operations than for primarily non-discretionary operations.
Design: A population-based retrospective cohort study.
Setting: Nine provinces (99.19% of Canada’s population).
Participants: All hospital inpatients who underwent any of 39 types of surgery and were separated from hospital between Apr. 1, 1988 and Mar. 31, 1990 (the most recent time period for which Canada-wide data were available at the subprovincial level analysed).
Main Outcome Measure: Rankings of the 39 procedures according to the index of variation, calculated from inpatient surgery rates in 255 census divisions across Canada.
Results: The 13 procedures with the greatest variation were all primarily discretionary. Thirteen of the 14 procedures with the lowest variation were primarily non-discretionary. All but one of the procedures whose degree of discretion was deemed intermediate were in the middle third of the rankings.
Conclusions: The greatest variation is found in primarily discretionary operations. Further investigation should be focused on identified geographical locations where rates for operations that are primarily discretionary are unusually high or low, and particularly on those operations for which there is disagreement regarding the indications for surgery.
Variation in surgical rates across different geographical areas is now well established in Canada, the United States and Europe.1 The rate of a specific operation may be many times larger or smaller in one area than another. However, the causes and significance of the variation, reviewed by McPherson,2 are still controversial.3–6 Apart from random variation,7–9 resource factors such as insurance, method of payment and numbers of surgeons and hospital beds have all been related statistically to differences in rates: more insurance, beds and surgeons, and fee-for-service payment have been associated with higher rates.10–14 Inappropriate use (too much or too little) has also been suggested, although not always confirmed.15,16 Treatment styles, hospital practices, consumer preferences, socioeconomic status, ethnicity and dissemination of research results are other factors that have been suggested and studied.17–21
For some types of surgery, the analysis of age- and sex-standardized rates controls, to some degree, for differences in disease prevalence in different geographical areas. Previously, we reported that normalized age- and sex-standardized rates provide a control for differing population sizes in small-area comparisons.22–25 In this study, we used normalized rates for 39 surgical procedures to construct an index of variation to rank the 39 operations in order of the degree of their variation across 255 census divisions in nine provinces (Prince Edward Island excluded). (A census division is a subprovincial geographical region formally defined by the Census of Population.26) We selected operations that are common or relatively common and are fully covered by health insurance,27 and we included examples from general surgery and the subspecialties. We also selected operations that have previously received attention in the literature and, to test the new index, operations expected to show increased variation because of the absence of outpatient surgery from our data file. (Extra variation would be expected because the relative frequency of inpatient and outpatient surgery varies in different geographical areas.)
Independent of and prior to the data analysis, the 39 procedures were categorized by one of the authors (E.V.) as primarily discretionary (15 operations), primarily non-discretionary (16 operations) or intermediate (8 operations).
The following criteria were used to classify procedures: primarily discretionary operations include those that may not be necessary at all, those for which there is not general agreement about indications (e.g., hysterectomy for nonmalignant conditions of the uterus) and those for which alternative, nonsurgical treatment options are available (e.g., varicose vein ligation and stripping). The indications for operations classified as primarily non-discretionary are less controversial, and such an operation is generally the only treatment or a treatment of choice (e.g., colectomy for colon cancer, severe colitis or polyposis and thyroidectomy for hyperthyroid goitre). The hypothesis examined was that there is greater variation (as measured by our index of variation) for primarily discretionary operations than for primarily non-discretionary operations.
Rates for a group of geographical areas will display relatively high variation if: (a) a few of the areas have unusually high or low rates (outliers), or both, or (b) all of the rates have relatively large underlying variability, or both (a) and (b). Our approach has been to find any unusually high and low rates and then to assess the underlying variability of the group of rates with the use of methods that are relatively unaffected by the presence of outliers. A previous paper25 identified outliers, and this paper deals with underlying variability, both studies making use of the same surgery data.
Methods
Counts of all surgical procedures performed on inpatients during the 2 years from Apr. 1, 1988 to Mar. 31, 1990 were calculated using hospital separation records from the Canadian Hospital Morbidity File maintained by the Health Statistics Division at Statistics Canada. For each of the 39 selected procedures (Table I), frequencies were tabulated by sex, age group and census division of residence of the person hospitalized, regardless of where the hospitalization occurred.
Thirty-nine Surgical Procedures Ranked According to Their Index of Variation (I95), Canada, Apr. 1, 1988 to Mar. 31, 1990
Procedures performed on an outpatient basis could not be counted because they are not included in the hospital data file. For complex procedures, such as coronary artery bypass, this is not a problem but for procedures that do not necessarily require admission to hospital, such as tonsillectomy or extraction of lens, differences in outpatient surgery practices could be a significant component of variation in rates. (Such procedures are identified by an asterisk in Table I.)
Surgical procedure rates were calculated for 255 of the 266 census divisions across Canada. This analysis covers all of Canada except Prince Edward Island, the territories, and two small census divisions in British Columbia. Overall, only 0.81% of the Canadian population was excluded.
For 17 of the 39 procedures, the analysis of individual census division rates excluded one or more of the nine provinces. This was done when more than 5% of a province’s records of hospital stays involving the procedure lacked identifying information about the patient’s census division of residence, usually because these hospital stays occurred outside the patient’s province of residence.
A normalized rate is the difference between the age- and sex-standardized census division rate and the rate for Canada (all 255 census divisions combined), adjusted for the census division population size (by dividing by the standard deviation).22–25 The 255 census divisions range in population size from 6910 (Montmorency, Que.) to 2 131 450 (Metropolitan Toronto). Normalized rates give census divisions with smaller population sizes more leeway than larger census divisions in differing from the national rate. This is desirable because smaller areas exhibit more random variation. The normalization process thus makes census division rates more comparable to each other and permits rates for different procedures to be compared with each other.
Outliers were identified by ranking the normalized rates and using methods developed by Tukey28 to determine if the values at or near the extremes were unusually high or low.25
We defined the index of variation (I95) for a particular surgical procedure as the width of a 95% interval calculated from the ordered normalized procedure rates. For a group of 255 census division rates, I95 is the difference between the average of the sixth and seventh largest values and the average of the sixth and seventh smallest values. The larger the value of I95, the greater the variation. The most extreme values are deliberately excluded in the calculation of I95 so that it will not be unduly influenced by outliers (unusually large or small values).
Results
Table I provides the values of I95 for the 39 surgical procedures and lists them in descending order of variation. The ranking that would result using I100 (the maximum minus the minimum normalized rate) is also shown. The table also includes the total number of outlier census divisions and the all-census-division rate for each procedure. Listed next to each procedure name is its Canadian Classification of Procedures (CCP) code.29
The rankings based on I95 differ from those based on I100, substantially for some procedures. That is because the presence of outliers can distort the amount of overall variation when measured by I100 and other measures based on extreme values.8,9
The 39 index values decrease smoothly from the fifth highest value (18.46) to the lowest value (3.96). The procedures having the four highest values of I95 (tonsillectomy with adenoidectomy, extraction of lens, tonsillectomy without adenoidectomy and hysterectomy) stand out as having particularly high variation. Three of these procedures are often performed on an outpatient basis and would therefore be expected to show increased variation because of the exclusion of day surgery from the data file. The fourth most variable procedure, hysterectomy, exhibits truly high underlying variability in rates across Canada. This procedure also yielded the highest number of outliers (26); of these, 18 were at the high end of the distribution and 8 were at the low end.25
Fig. 1 shows the distribution of normalized census division rates by province for the most variable procedure in Table I (tonsillectomy with adenoidectomy), the fourth most variable (hysterectomy) and the least variable (repair of atrial and ventricular septa). There is clear agreement between the variation visually apparent in Fig. 1 and the ranking of these procedures in Table I. Tonsillectomy with adenoidectomy had normalized census division rates ranging from −23.7 to 36.3, yielding the highest values of both I100 and I95, and this procedure had 12 outliers. Hysterectomy had normalized census division rates ranging from −24.6 to 18.0 and had 26 outliers. In contrast, repair of atrial and ventricular septa had normalized rates ranging from −2.3 to 3.2, yielding the lowest values of both I100 and I95, and this procedure had only three outliers. (The unnormalized rates for tonsillectomy with adenoidectomy ranged from 4 to 358 per 100 000 population, for hysterectomy they ranged from 231 to 972 and for repair of atrial and ventricular septa they ranged from 0 to 15.)
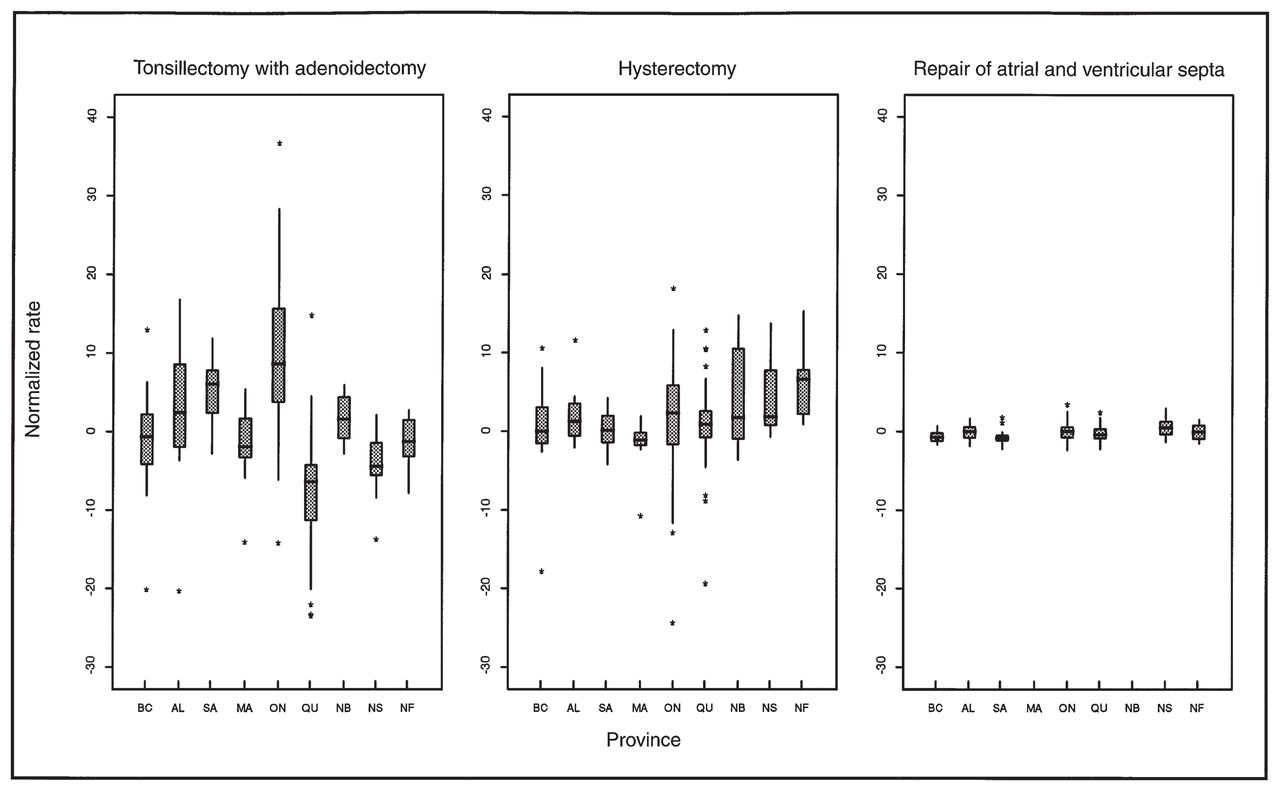
Distribution, by province, of normalized census division rates for most variable, fourth most variable and least variable surgical procedures. These box plots28 show 25th percentile, median, 75th percentile and outlying observed rates for each distribution. Rates of repair of septa were not analysed for Manitoba and New Brunswick because more than 5% of census divisions were unidentified. BC = British Columbia, AL = Alberta, SA = Saskatchewan, MA = Manitoba, ON = Ontario, QU = Quebec, NB = New Brunswick, NS = Nova Scotia, NF = Newfoundland.
Table I also identifies the 15 procedures classified as primarily discretionary (denoted by D), the 16 classified as primarily non-discretionary (N) and the 8 classified as intermediate (I). For Canada, the 13 procedures with the greatest variation (ranks 1 to 13 in Table I) had all been classified previously as primarily discretionary, and 7 of these were performed only on a hospital inpatient basis between 1988 and 1990. Of the 14 procedures with the lowest indices of variation (ranks 26 to 39), 13 had previously been classified as primarily non-discretionary. The 14th — radical mastectomy — is a subset of radical and modified radical mastectomy and would therefore be expected to vary less. The 13 primarily discretionary operations (with ranks 1 to 13) had a total of 172 outlier census divisions (averaging 13 per procedure), whereas the 13 procedures with the lowest indices of variation (with ranks 27 to 39) had a total of 91 outlier census divisions (averaging only 7 per procedure). Furthermore, no primarily non-discretionary procedure was among the 16 most variable procedures (ranks 1 to 16), and no primarily discretionary procedure was among the 20 least variable procedures (ranks 20 to 39).
The ordering of the procedures in Table I very strongly supports the hypothesis that there is greater variation for primarily discretionary operations than for primarily non-discretionary operations.
Discussion
We compared the results of our Canada-wide analysis with those of a recent study by The Institute for Clinical Evaluative Sciences (ICES) of rates for 12 surgical procedures in Ontario,30 although there were a number of important differences in design of the two studies. We compared our list of Ontario outliers with the areas found by ICES to have significantly high or low rates, for the five ICES procedures (total hip replacement, total knee replacement, carotid endarterectomy, coronary artery bypass and hysterectomy) that matched ours exactly or almost exactly in definition. For all five procedures, ICES identified more significantly high and low rates than we found outliers in Ontario. Allowing for the differences between the two studies, we concluded25 that our identification of outliers was more conservative than that of ICES (however, our outlier detection algorithm can readily be adjusted to be less restrictive). We also compared ICES rankings of these procedures in order of variation with our rankings for Ontario. Our rankings based on I95 (Table I) agree exactly with ICES rankings based on a χ2 test of a type that has been preferred in the literature.8
We found that when inpatient surgical rates were standardized for age and sex and then normalized to adjust for population size, considerable geographical variation persisted. When these normalized rates are used as the basis for the calculation of an index of variation that eliminates extreme outlier census divisions, the hypothesis that the greatest amount of variation will be found for primarily discretionary operations is strongly supported. This finding has implications for both the quality and the cost of medical care. It would allow the provinces, which have the fiscal responsibility to pay for medical care and the authority (together with medical regulatory bodies) to regulate medical care, to focus on certain primarily discretionary operations with unusually high rates, considerable variation and disagreement regarding indications for surgical treatment. In the United States, a comparable strategy to deal with small-area variation in surgical rates has been proposed and implemented by Wennberg.31–33 Until better outpatient surgery data are available, recommendations regarding operations performed in large numbers on an outpatient basis cannot be made. However, the provinces could, for example, turn their attention to cholecystectomy,34,35 prostatectomy,36–38 hysterectomy,39–42 intervertebral disc surgery and cesarean section.43
In the case of cesarean section, indications for this procedure were examined in Canada in 1986 by means of an evidence-based consensus conference.44–46 Considerable public awareness of the conference’s recommendations and support from professional obstetrician/gynecologist organizations and women’s groups resulted in an increase in the rate of vaginal birth after cesarean section in Canada from 9 per 100 previous cesarean sections in 1985/86 to 33.4 in 1993/94 and a decrease in the overall cesarean section rate for the first time in two decades, from a high of 19.6 per 100 deliveries in 1987/88 to 17.6 in 1993/94.20,47
Comparable initiatives could be undertaken for gallbladder, prostate and uterine surgery. Because our earlier study25 had identified census divisions with high and low rates for cholecystectomy, prostatectomy and hysterectomy, it would be possible to conduct in-depth studies of surgical practices in these census divisions as a part of the evidence-gathering for consensus conferences that would evaluate the efficacy of surgical and nonsurgical treatments of asymptomatic gallstones, benign prostatic hypertrophy, prostate cancer and nonmalignant diseases of the uterus and cervix. If, as we suspect, the high surgical procedure rates are too high, then steps taken to reduce the rates will improve health and the quality of life while saving tax dollars.
Footnotes
[Drs. Tandan and Langer comment on this article in the Quill on Scalpel section (pages 351 and 352), and Drs. Gentleman and Vayda and Mr. Parsons respond in the Correspondence section (pages 425 and 426).]
- Accepted February 13, 1996.
References
In this issue

Article tools


Related Articles
Cited By...
- No citing articles found.