


Abstract
Background: Given limited resources for injury prevention, it is essential to determine which mechanisms of injury to target to provide the most benefit to the largest proportion of the population. We developed objective, evidence-based injury prevention priority scores (IPPSs) for the Canadian population across 4 prevention perspectives: mortality, injury severity, resource use and societal cost.
Methods: We performed a retrospective cohort study of all injuries in Canada from 2009/10 to 2013/14. Hospital admissions were obtained from the Discharge Abstract Database, and deaths from the Statistics Canada Canadian Vital Statistics Death Database. For each mechanism of injury, we calculated an IPPS as a balanced measure of injury frequency and 1) mortality rate, 2) median 1 – ICISS (Injury Severity Score derived from the International Statistical Classification of Diseases and Related Health Problems, 10th revision, enhanced Canadian version), 3) median cost per hospital stay or 4) median potential years of life lost (PYLL), providing a ranking of mechanisms of injury in priority order. The IPPS by definition has a mean of 50 and a standard deviation of 10. The higher the IPPS, the higher the priority for injury prevention.
Results: A total of 694 535 injuries were identified over the study period. The most frequent mechanism of injury was falls (391 068 [56.3%]). The overall mortality rate was 0.09 deaths/injured person, the median 1 – ICISS was 0.017, the median cost was $5217, and the median PYLL was 0. The mechanisms with the 3 highest IPPSs were falls (75), self-harm (67) and drowning (66) for mortality; falls (77), drowning (70) and suffocation (61) for severity; falls (80), suffocation (63) and fire (60) for resource use; and falls (72), assault (62), and firearms and legal interventions (59 in both cases) for societal cost.
Conclusion: This study produced IPPSs for traumatic injuries in Canada that provide objective and quantifiable methods for identifying mechanisms of injury to target for specific prevention initiatives. Preventing falls would provide the most benefit to the largest proportion of Canadians and should be prioritized in injury-prevention policy.
Unintentional injuries are the leading cause of death among people younger than 44 years of age.1,2 They account for about 4.8 million deaths and affect 973 million people annually worldwide.3 In Canada, injuries represent the leading cause of death among people aged 1–35 years4 and accounted for 17 843 deaths5 and 131 366 hospital admissions6 (excluding Quebec) in 2018/19.
The mechanism of injury is defined as the fundamental physical process responsible for a given action, reaction or result, and includes falls, motor vehicle collisions, assaults and drownings. Mechanisms of injury are perceived as modifiable risk factors and are commonly the target of injury-prevention policy and research. To produce effective injury-prevention policy, mechanisms of injury must be identifiable, quantifiable and prioritized according to the highest burden.
Given the finite resources available for injury prevention, it is critical to know where best to invest time, effort and funds. Many metrics exist for measuring disease burden from injuries, including mortality indices, morbidity indices and cost measures.7 As each of these metrics has respective limitations, using a single metric would provide only a partial understanding of the burden of injury. Therefore, injury-prevention policy is best planned through examination of multiple injury metrics in combination, thus addressing all domains of an injury. Haider and colleagues8 proposed the injury prevention priority score (IPPS), which provides a simple, objective and quantitative method for ranking injury mechanisms by combining the relative frequency of a mechanism of injury and a priority metric of interest. This tool can be used to combine different domains of injuries, including mortality, morbidity and cost, and has been employed to rank mechanisms of injury in children in the United States9 and Canada.10 To our knowledge, such analysis has not been performed in the Canadian adult population.
We developed objective, evidence-based IPPSs for traumatic injuries in Canada across 4 injury-prevention perspectives: mortality, injury severity, resource use and societal cost.
Methods
Cohort selection and data sources
We performed a retrospective cohort review of all traumatic injuries in people of all ages in Canada from Apr. 1, 2009, to Mar. 31, 2014. Data sources included the Canadian Institute for Health Information Discharge Abstract Database (DAD) and the Statistics Canada Canadian Vital Statistics – Death database (CVSD). The DAD is the most comprehensive database for Canadian in-hospital information and contains demographic (e.g., patient sex, date of birth, province of admission), administrative and clinical information concerning all inpatient hospital admissions in Canadian provinces, except Quebec. It also contains up to 25 admitting diagnoses coded with the enhanced Canadian version of the International Statistical Classification of Diseases and Related Health Problems, 10th Revision (ICD-10-CA) and cost information including Case Mix Groups+ (CMG+) and resource intensity weight (RIW), used to estimate the cost of a hospital stay (further detailed below).11 The CVSD contains demographic data and underlying cause of death for all fatalities (among Canadian residents and nonresidents) occurring in Canada. Each death has an associated underlying cause of death, coded with ICD-10-CA codes.12,13 As registration of death is a legal requirement in each Canadian province, reporting is virtually complete, and overcoverage is avoided by identification of duplicates.12
Cases included were injuries in any person who was admitted to hospital or died with an associated ICD-10-CA diagnostic code consistent with an external cause (V01–Y98) in the DAD or CVSD. Exclusion criteria included hospital admission or death secondary to poisoning (ICD-10-CA codes X40–X49, X70–X69, X85–X90, Y10–Y19 and Y35.2) or an adverse medical event (ICD-10-CA codes Y40–Y59, Y60–Y84 and Y88–Y89), and lack of a valid health card number. We excluded poisoning and adverse medical events from the analyses given the more unique sociocultural risk factors related to these external causes of injuries.
Variable definition
Our exposure of interest was mechanism of traumatic injury, grouped according to the US Centers for Disease Control and Prevention (CDC) proposed framework for presenting injury data.14 To adhere to confidentiality requirements, we adapted the CDC categories (Appendix 1, available at www.canjsurg.ca/lookup/doi/10.1503/cjs.021420/tab-related-content). If a hospital admission was associated with more than 1 ICD-10-CA diagnostic code for mechanism of injury, we retained the first code used as the mechanism of injury; therefore, cases with multiple injury diagnosis codes were considered as having a single injury event. We calculated injury frequency by summing the unique hospital admissions from the DAD and the unique deaths from the CVSD, then subtracting the in-hospital deaths from the total to remove the overlap between in-hospital deaths in the DAD and out-of-hospital deaths in the CVSD. The final value represented the number of unique traumatic injuries resulting in death or hospital admission in Canada from 2009/10 to 2013/14.
The outcomes of interest were IPPSs (described below), derived from data across 4 domains: mortality, injury severity, resource use and societal cost. We measured mortality as the fatality of each mechanism and calculated it as the total number of deaths associated with a specific mechanism of injury category, divided by the number of injured people (who were admitted to hospital or died) associated with that category. Because the Injury Severity Score was unavailable in most databases, including the DAD and CVSD, we measured injury severity through the ICD-10-CA–derived Injury Severity Score (ICISS), which uses the specific survival risk ratio of each diagnostic code associated with trauma (ICD-10-CA codes S00–T78).15 The specific survival risk ratio represents the number of people with the specific ICD-10-CA code who survived, divided by the total occurrences of the ICD-10-CA code in a large pooled data set of more than 4 million observations in people of all ages from 7 countries.15,16 Thus, the specific survival risk ratio represents the probability of survival in each individual injury. If a person has more than 1 ICD-10-CA injury code, the ICISS becomes the multiplication of the survival risk ratio associated with his or her respective ICISS. As the IPPS requires an ordinal structure in ascending order and the ICISS is in descending order, we modified the ICISS to 1 – ICISS in the calculation of the IPPS for injury severity. This then includes the probability of death (1 – ICISS) instead of the probability of survival (ICISS) in the severity IPPS calculation. For consistency, we reported 1 – ICISS throughout the results.
We defined resource use as the sum of all charges associated with an injury and measured it for hospital stays only, through the Canadian Institute for Health Information’s cost estimator. The CMG+ methodology is designed to aggregate acute care inpatients with similar clinical and resource-use characteristics.17 The DAD assigns a CMG+ to each hospital admission, and each CMG+, in turn, is associated with a baseline RIW.18 The base RIW represents the standardized estimate of resource consumption.19 The RIW for each hospital admission represents the relative resources used, adjusted on a case-by-case basis depending on age group, length of stay, comorbidity level and interventions received.19,20
The baseline cost of a standard hospital stay was estimated by the Canadian Institute for Health Information based on aggregate data across provinces. Among the territories, as the cost of a standard hospital stay is available only for the Yukon and not the Northwest Territories or Nunavut, we combined the 3 territories into a single geographic unit and applied the cost of a standard hospital stay for the Yukon to all the territories as a whole. We estimated the cost of each hospital stay as the product of the cost of a standard hospital stay multiplied by the RIW for a given stay. For people with repeat hospital admissions, we calculated and summed the cost of each stay, treating them as a single hospital stay. To adapt for inflation, we adjusted each cost according to the Consumer Price Index for health published by Statistics Canada,21 using 2009 as the base year.
We measured societal cost by potential years of life lost (PYLL), which is calculated by deducting a person’s life expectancy by the age at death. We obtained life expectancy at birth through Statistics Canada22 and deducted age at death from it using data from the CVSD. We calculated the median PYLL for each mechanism of injury.
Statistical analysis
We summarized each priority metric in a single measure for each mechanism of injury: fatality rate per injured person for mortality, median 1 – ICISS for injury severity, median cost per hospital stay for resource use and median PYLL for societal cost. We chose the median as the summary statistic for 1 – ICISS, cost of hospital stay and PYLL because their respective distributions were skewed toward the left.
We calculated IPPSs for each outcome measure, combining the frequency and the priority outcome of interest,8 and adapted them to each domain, similar to the method described by Wiebe and colleagues.9 We created 2 Z scores, 1 for frequency of the mechanism of injury and 1 for the priority metric, based on their respective distributions. We then summed the 2 Z scores obtained (Zsum) and created a new composite Z score by dividing the difference between the sum of Z scores and the mean of the Z score sum by the standard deviation of the Z score sum. Finally, we derived the IPPSs by calculating a T score for each mechanism of injury, where T = 50 + 10Zsum. An IPPS has, by definition, a mean of 50 and a standard deviation of 10. An IPPS is used only as a comparator, and the absolute values are not interpretable in isolation. The higher the IPPS, the higher the mechanism of injury should be prioritized for injury prevention.
In addition, to examine provincial variation, we reported the IPPS for each mechanism at the provincial level for injury severity and resource use. Because provincial-level data were inaccessible from the CVSD (owing to data privacy restrictions), the analysis was not performed for mortality or societal cost, and was restricted to patients admitted to hospital. Missing data were treated by case-wise deletion.
We performed all analyses using Stata version 14 (StataCorp). The study was approved by the Nova Scotia Health Authority Research Ethics Board (project no. 1022463).
Results
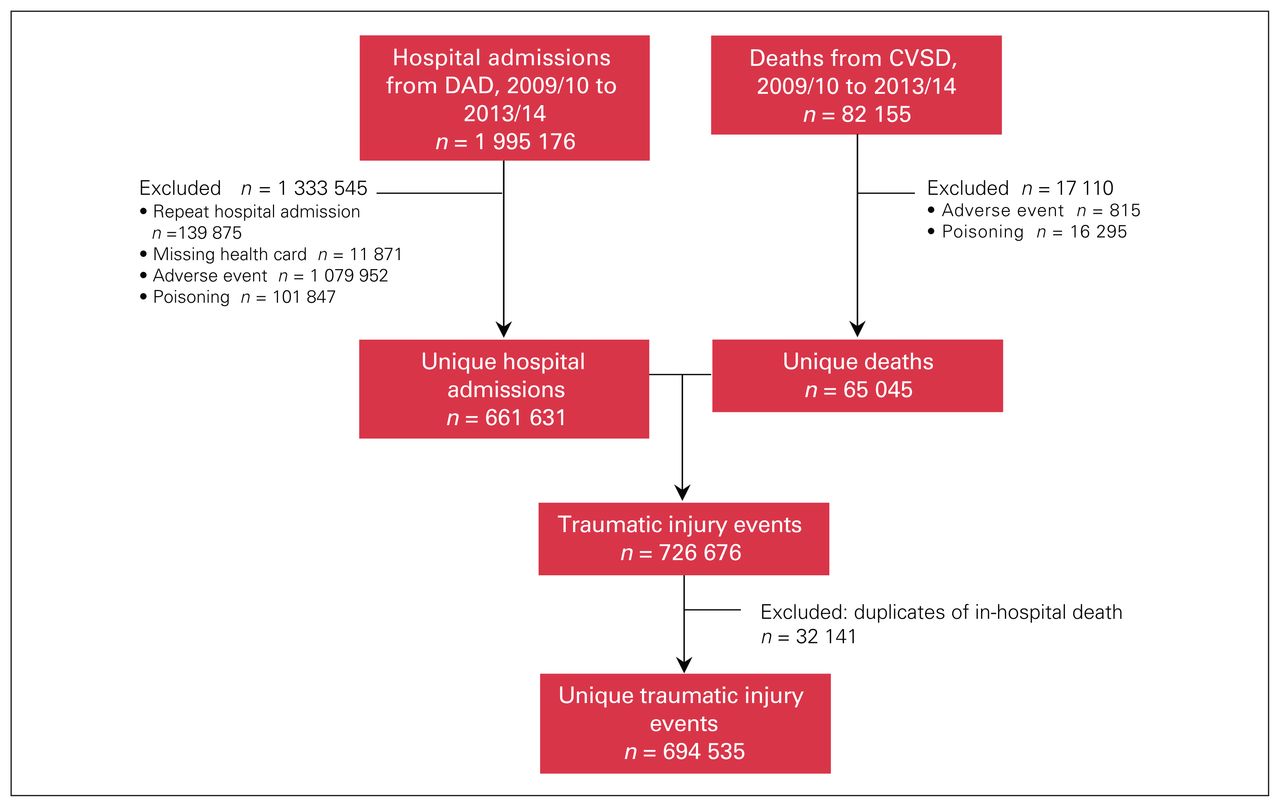
After we excluded repeat hospital admissions for the same injury (n = 139 875), missing health card numbers (n = 11 871), adverse medical events (n = 1 079 952) and cases of poisoning (n = 101 847), our in-hospital cohort consisted of 661 631 unique hospital admissions for traumatic injury (Figure 1). Similarly, after we excluded adverse medical events (n = 815) and poisoning cases (n = 16 825), our mortality cohort consisted of 65 045 deaths from traumatic injury. Excluding the 32 141 in-hospital deaths that were counted in both data sources resulted in a final cohort of 694 535 unique traumatic injuries in Canada from 2009/10 to 2013/14. In our final cohort, we had complete data for our measure of exposure (mechanism of injury), mortality (fatality rate), resource use (hospital stay cost) and societal cost (PYLL); the data for our severity measure (1 – ICISS) were 95.8% complete.

Flow diagram showing traumatic injuries resulting in hospital admission or death in Canada, 2009/10 to 2013/14. CVSD = Canadian Vital Statistics Death Database; DAD = Discharge Abstract Database.
The most frequent mechanisms of injury were falls (391 068 [56.3%]) and motor vehicle collisions (68 976 [9.9%]); in 60 481 cases (8.7%), the mechanism was unspecified (Table 1). Most injuries occurred among older people, with 292 455 people in the cohort (42.1%) aged 70 years or older (Figure 2). Table 1 also summarizes the injury frequency, fatality rate, median 1 – ICISS, median cost per hospital stay and median PYLL by mechanism of injury. The overall fatality rate was 9.0%. The highest fatality rates were seen with self-harm (72.2%) and drowning/submersion (71.8%), followed by suffocation (37.0%). The overall median 1 – ICISS was 0.017. Drowning/ submersion had the highest median 1 – ICISS (0.148), followed by suffocation (0.101) and pedestrian incidents (0.037). The overall median cost per hospital stay was $5217 (interquartile range [IQR] $3367–$1024), with suffocation accounting for the highest median hospital stay cost ($8530), followed by fires ($7673) and falls ($6243). The median PYLL by mechanism of injury was 0, as more than half of the injuries (372 801 [53.7%]) occurred in people who were older than their life expectancy. Assaults, firearms and legal interventions had the highest median PYLL (38).
Summary statistics by mechanism of injury for calculation of injury prevention priority scores for mortality, severity, resource use and societal cost in Canada, 2009/10 to 2013/14
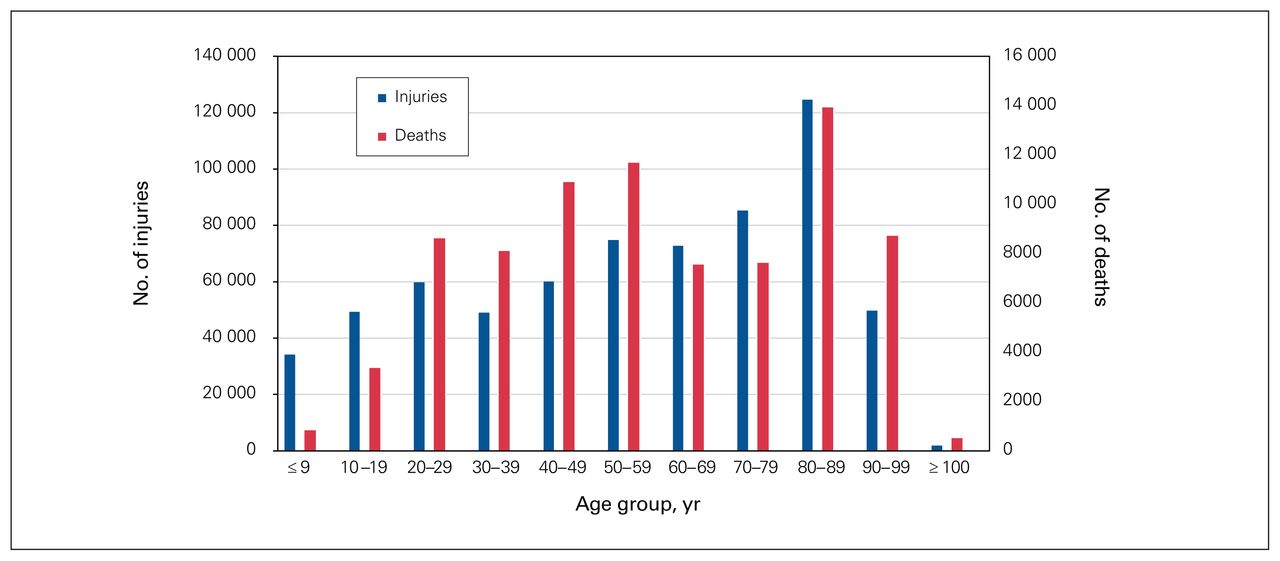
Age distribution of traumatic injuries and deaths in Canada, 2009/10 to 2013/14.
On average, per year, falls were responsible for 4310 deaths, $1.16 billion in resource use and 1072 PYLL.
We used the summary statistics at the bottom of Table 1 to calculate the IPPSs (Table 2). The mechanisms of injury with the 3 highest IPPSs in the mortality domain were falls (75), self-harm (67) and drowning/submersion (66); in the severity domain, falls (77), drowning/ submersion (70) and suffocation (61); in the resource use domain, falls (80), suffocation (63) and fire/flame (60); and in the societal cost domain, falls (72), assaults (62) and firearms and legal interventions (59 in both cases).
Ranking of mechanisms of injury by injury prevention priority score for mortality, severity, resource use and societal cost in Canada*
Most provinces/territories had similar IPPSs for severity with identical mechanism rankings, except for Prince Edward Island, where falls (IPPS 75), firearms (IPPS 73) and drowning/submersion (IPPS 55) were the mechanisms with the 3 highest IPPSs in the severity domain (Table 3). In contrast, there was marked heterogeneity in the IPPSs for resource use across provinces/territories: although falls had the highest IPPSs for this domain, the second and third IPPS rankings varied substantially (Table 4).
Ranking of mechanisms of injury by injury prevention priority score for severity, by province/territory
Ranking of mechanisms of injury by injury prevention priority score for resource use, by province/territory
Discussion
We produced objective and quantifiable IPPSs for traumatic injuries in Canada that provide targets for prevention, policy research and funding. Our results echo the work published in 2015 by Parachute Canada,23 which identified falls, self-harm and transport incidents as the largest contributors to mortality and morbidity, and other, unintentional injuries and transport incidents as the largest contributors to hospital admission burden. In the present study, although the IPPS ranking changed according to which domain was examined, falls consistently had the highest IPPS. This suggests that preventing falls would provide the most benefit to the largest proportion of the population. This was driven by the high frequency of falls, 56.3%. The corresponding Z score for fall frequency was 3.789, well above the Z scores for frequency for the other mechanisms, which explains why falls had the highest IPPS despite not having the highest fatality rate, median 1 – ICISS, median resource use or median PYLL.
This high fall frequency is similar to that in the Global Burden of Disease study,3 in which falls accounted for 14.6% of outpatient injuries and 36.5% of inpatient injuries. Similarly, in 2010 in Canada, falls were associated with 55.4% of hospital admissions and 25.7% of deaths from traumatic injury.23 The 2009/2010 Canadian Community Health Survey indicated an increasing frequency of fall-related injuries in Canadians aged 65 years or older from 2003 to 2009/2010.24 In 2009/2010, there were 256 011 falls in this age group (57.5 per 1000), and in 2008, there were 2691 deaths due to falls in this age group, with an age-standardized mortality rate of 4.7 per 10 000. Falls, especially among older people, are not often thought of when one considers trauma, but they can be associated with devastating consequences: they have a 2.2% mortality risk,25 and a history of falls in those aged older than 71 is associated with declines in basic and instrumental activities of daily living, and increased risk of nursing home admission.26,27
Interestingly, the mechanisms of injury with the 3 highest median PYLL were all intentional injuries: assaults, firearms and legal interventions. Although their relative frequencies did not create a high IPPS, it is likely that these injuries, although less frequent, affect younger populations disproportionately and thus have a higher societal impact. The intentional aspect of these injuries may make them a more feasible target for prevention through education initiatives rather than through more classical or infrastructure-related initiatives.
The IPPSs for severity and resource use were similar across provinces/territories. Care should be taken in translating our results into injury-prevention policy, as the provincial/territorial data are restricted to a proportion of the Canadian population. Specifically, they include only patients admitted to hospital, exclude Quebec and provide an incomplete picture of the burden of traumatic injury at the provincial/territorial level. However, our results underline the flexibility of the IPPS.
If the analysis were performed with data for the entire Canadian population, more accurate results would be obtained, which could assist policy-makers. If some mechanisms were ranked similarly across several jurisdictions, policy-makers could target these at the national level, whereas provinces whose results differed strongly from national trends might select not to adopt such initiatives or to adapt them to regional needs. For example, in the present study, the relative consistency of falls, drowning/ submersion and suffocation having the top 3 IPPSs for severity might reassure decision-makers that national initiatives aimed at reducing these mechanisms would decrease the burden of traumatic injuries across all priority metrics. In contrast, Prince Edward Island displayed a higher IPPS for firearms in the severity and resource use domains than other jurisdictions, and the territories displayed a higher IPPS for legal interventions in the resource use domain than other jurisdictions. Both of these regions have smaller populations than other jurisdictions in Canada, which may explain the higher variation compared to the national cohort. Alternatively, there may be other region-specific policy or cultural differences that explain these differing results. Both of these regions could use their own data in deciding whether to accept, reject or adapt national injury-prevention policies and initiatives.
The fact that the ranking of mechanisms of injury other than falls varied according to which domain was examined underlines the importance of targeting different mechanisms depending on which outcome one wishes to reduce. For example, if mortality reduction is a priority, prevention efforts would be focused on self-harm and drowning in addition to falls, whereas if decreasing hospital costs is desired, prevention efforts would be focused on suffocation and fires in addition to falls. Some mechanisms of injury, such as falls and, to a lesser degree, motor vehicle collisions (which were consistently ranked fourth or fifth), featured prominently across all domains. If these mechanisms were prevented, the burden of injury would be decreased across all domains. Furthermore, our data lend themselves to modulable interpretations, depending on which domain is being considered. Although not performed in our data set, one could further rearrange the mechanisms of injury if desired. For example, one may wish to examine intentional versus unintentional injuries, transport injuries versus other injuries, or violence-related injuries versus other injuries in order to tease out which category requires prioritization.
It must be acknowledged that prioritization of injury-prevention efforts cannot be predicated only on burden. Factors such as modifiability (the presence of actual means to effect change), acceptance (from a societal point of view), feasibility (availability of appropriate resources) and evaluability (ability to measure change) are only some of the other perspectives that must also be considered.28
Identifying which mechanisms of injury to target is only the first step in injury prevention. Our study did not examine which mechanisms are the most modifiable and which interventions will yield the most benefit. We hope our findings prompt further examination into interventions aimed at reducing the burden of traumatic injury.
Limitations
The major strength of this study is the comprehensive data set and large cohort, which allowed for a near-complete picture of traumatic injuries in Canada from 2009/10 to 2013/14. It identified IPPSs that rank mechanisms of injury by combining the relative frequency of a mechanism and a priority metric of interest.
Our study has several limitations. Temporal changes in injury burden must be taken into consideration when using data to influence prevention policies. However, although we could have examined temporal trends in IPPSs, it is unlikely that significant changes would have been detected over the short 5-year time frame chosen. Administrative data, which are not collected for research purposes, lack detail and are unable to adjust for important yet unmeasured variables. For example, in our study, 8.7% of mechanisms of injury were classified as unspecified. Further detail could help better classify each mechanism and identify priority mechanisms. There is also likely a lack of documentation in the patient medical record in some cases, leading to classification of the mechanism as unspecified. Better documentation could assist in better classification of mechanisms.
The population of patients with traumatic injuries is highly heterogeneous, as shown by our 3-peaked age distribution, and classification according to more specific sub-groups could aid specific policy implementation. We grouped mechanisms of injury according to the framework proposed by the CDC for presenting injury data.14 Although this classification is widely used, it has not been validated prospectively. Misclassification of mechanisms of injury may occur, especially as social stigma may affect the coding of intent, which could misclassify intentional self-harm and assault as firearm injuries, for example. This would overestimate the IPPS of the latter at the expense of the former.
Our injury severity metric is objective; however, because it was scaled to mortality, nonfatal injuries may have been underrepresented. For example, nonfatal mechanisms of injury causing chronic back pain would not produce a high IPPS, although they may have substantial associated morbidity. In addition, injuries that occur in populations with many comorbidities, such as falls in older people, may be artificially considered more severe, as this population is more likely to die when admitted to hospital in general,29 as opposed to specifically secondary to a given injury. Some hospital admissions may include more than 1 mechanism of injury, for example, if a person drowns via intentional self-harm. If more than 1 ICD-10-CA code for external cause was available, we selected the first one presented, as we believed this would be the most likely to represent the overall mechanism of injury. However, misclassification may have occurred, depending on the coding. Only 10.4% of mechanisms had more than 1 ICD-10-CA code for external cause; therefore, the potential effect of misclassification should be small.
Although our cost analysis was based on validated metrics, repeat hospital admissions may have been underestimated, as the cost was calculated as the sum cost of both hospital stays and did not account for hospital transfers. Furthermore, our cost estimates were limited to hospital stay costs and did not account for outpatient care or costs associated with disability and lost productivity.
Several patient groups were not accounted for in our cohort, including patients admitted to hospital in Quebec, as that province does not contribute data to the DAD. However, fatalities in Quebec were counted, as they figure in the CVSD. Given that Quebec represents 22.6% of the Canadian population,30 hospital admissions from this province would affect our overall results. Traumatic injuries treated in the outpatient setting were also not captured in our data set. This would not have affected our mortality and PYLL measures, and one could assume that the most severe injuries would have been treated in hospital and thus would be captured in our data set. However, it is possible that injuries due to certain mechanisms are treated in the outpatient setting at such an overwhelming frequency that they would not have been captured in our data set; these injuries would increase the associated IPPSs for severity and cost substantially. Further study incorporating outpatient care could determine whether such mechanisms exist.
Conclusion
This study produced IPPSs for traumatic injuries in Canada that provide objective and quantifiable methods for identifying mechanisms of injury to target for prevention initiatives. Efforts to prioritize injury mechanisms with the use of such methods will help allocate limited time, resources and efforts to obtain the most benefit to the largest proportion of the population. Preventing falls would provide the most benefit to the largest population of Canadians and should be prioritized in injury-prevention policy.
Footnotes
Competing interests: None declared.
Contributors: All authors designed the study. S. Jessula acquired the data, which all authors analyzed. S. Jessula wrote the manuscript, which N. Yanchar, R. Romao, R. Green and M. Asbridge critically revised. All authors gave final approval of the article to be published.
- Accepted May 25, 2021.
This is an Open Access article distributed in accordance with the terms of the Creative Commons Attribution (CC BY-NC-ND 4.0) licence, which permits use, distribution and reproduction in any medium, provided that the original publication is properly cited, the use is noncommercial (i.e., research or educational use), and no modifications or adaptations are made. See: https://creativecommons.org/licenses/by-nc-nd/4.0/
References
In this issue

Article tools


Related Articles
Cited By...
- No citing articles found.