


Abstract
Background: Correction of a fixed flexion deformity is an important goal when performing total knee arthroplasty. The purpose of this study was to assess the accuracy of clinical assessment compared with imageless computer navigation in determining the degree of fixed flexion.
Methods: We performed navigation anatomy registration using 14 cadaver knees. The knees were held in various degrees of flexion with 2 crossed pins. The degree of flexion was first recorded on the computer and then on lateral radiographs. The cadaver knees were draped as they would be for a total knee arthroplasty, and 9 examiners were asked to clinically assess by visual observation the amount of fixed flexion. Three examiners repeated the process 1 week later.
Results: The mean error from the radiographs in the navigation group was 2.18° (95% confidence interval [CI] 1.23°–3.01°) compared with 5.57° (95%CI 4.86°–6.29°) in the observer group. The navigation was more consistent, with a range of error of −5° to +5.5° compared with −18.5° to +17.5° in the observer group. The observers tended to underestimate the amount of knee flexion (median error −4°), whereas the navigation group was more evenly distributed (median error 0). The highest concordance coefficient was found between navigation and radiography (0.96). The concordance coefficient was 0.88 for the 3 surgeons who repeated the measurements 1 week later (mean error 3.5°, range 15°).
Conclusion: The use of computer navigation appears to be a more accurate method for assessing the degree of knee flexion, with a reduced range of error compared with clinical assessment. The use of computer-assisted surgery may therefore provide surgeons with the information required to more consistently restore full extension during total knee arthroplasty.
Fixed flexion contracture is a common sequelae to knee osteoarthritis, especially in association with varus.1 Correction of this deformity is one of the goals of total knee arthroplasty (TKA). Various methods have been recommended to correct this deformity, including soft tissue release2 and further bone resection.3,4 Correction of the deformity at the time of surgery is important for a number of reasons. Residual flexion contracture requires increased work by the quadriceps during weight bearing, especially when ambulating, and may increase forces across the patella femoral joint.5–9 Weight bearing on a flexed knee may also place increased stresses across the abnormally loaded posterior condyles and posterior tibial plateau.6
Computer-assisted surgery (CAS) has been implemented in TKA to improve the accuracy of the procedure. Numerous authors have shown CAS to increase the accuracy of bony cuts in the coronal10–13 and sagittal planes.11–13 It has also been shown to improve the rotational alignment of the femoral component14 and to assess and balance soft tissue deformities in the coronal plane.15
To correct fixed flexion deformity during TKA, most surgeons rely on clinical judgment at the time of surgery. The purpose of this study was to assess the accuracy of clinical assessment compared with imageless computer navigation in determining the degree of fixed flexion.
Methods
We obtained 14 cadaver legs for use in this study with approval from the hospital ethics committee. We used a standard medial para-patella approach to expose the intra-articular structures of the knee. We used a Stryker Knee Navigation System (version 2.0). We placed 4-mm tracking pins in predrilled bicortical holes in standard positions in the distal femur and proximal tibia. The registration of anatomic landmarks to define the mechanical axes was carried out according to the system’s standard protocol. We established the centre of the femoral head by use of the kinematic method after registration of 200 points. The centre of the distal femur was then registered at a point about 1 cm anterior to and just medial to the centre of the femoral notch. The centre of the tibia was registered as the point just posterior to the tibial insertion of the anterior cruciate ligament, behind the medial third of the tibial tuberosity. The centre of the ankle was registered as the centre of the talus, superimposed on the transmalleolar axis.
The knees were then fixed in various degrees of flexion (range 3.5°, hyperextension to 22.5° flexion) and held with 2 or 3 crossed 5-mm threaded bolts. The final position of flexion was then checked on the navigation system and recorded.
We then obtained a direct lateral radiograph and measured the amount of flexion using the method described by Paley16 (Fig. 1). Paley stated that normal full extension can be calculated by use of the centre of rotation of the hip, knee and ankle and is in the range of 0°–5° hyperextension. This allows the mechanical axis of the limb to sit anterior to the centre of knee rotation in full extension. Paley did, however, note that there was poor consensus as to the exact location of these centres of rotation. He advocated using lines along the anterior cortex of the distal femur and proximal tibia, and he found that this closely approximated the value obtained using the long axes.16

Radiographic measurement of knee flexion according to the method described by Paley.16
The specimens were then prepared to resemble the view seen during knee arthroplasty, with a drape over the proximal thigh (Fig. 2). However, no tourniquet or foot draping was used. The specimens were presented in random order to 9 observers (3 orthopedic surgeons, 3 clinical fellows and 3 orthopedic residents). The leg was suspended by the ankle (with the hip flexed to about 45°), and the observers visually assessed the specimens and recorded the amount of knee flexion or hyperextension.
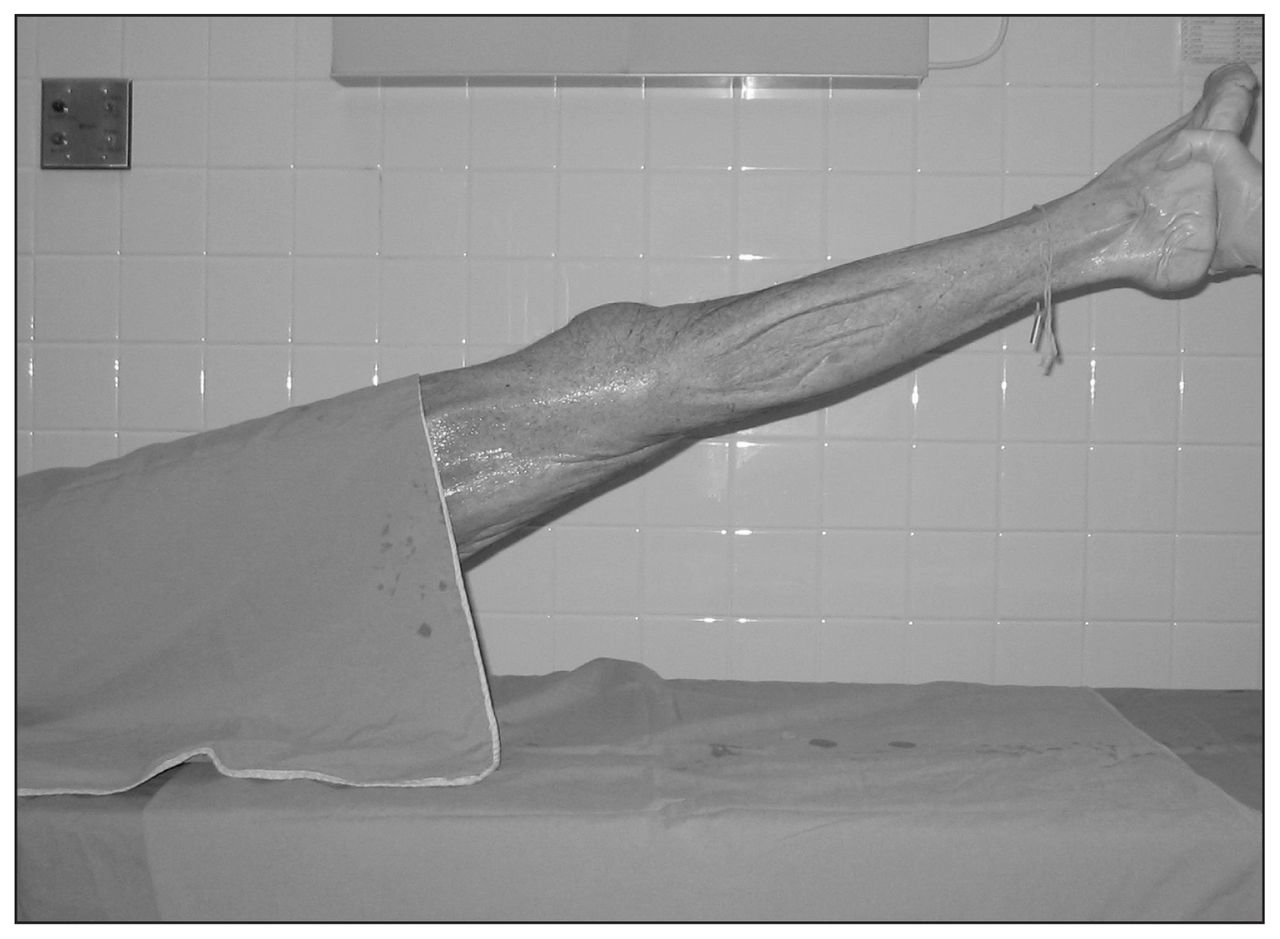
Specimens were prepared for visual assessment to mimic the view seen during total knee arthroplasty.
Three observers returned 1 week later and were asked to again estimate the degree of flexion of the limbs. The limbs were presented to the observers in a different order than during the initial viewing. The limbs were carefully stored with the fixation pins in situ to prevent any movement of the knee joint.
Statistical analysis
We performed statistical analyses using the SAS package, SPSS and Stata SE 8.2.17 We used Lin’s concordance correlation coefficient18 to assess the agreement of continuous measures obtained by 2 methods. A Lin’s concordance value of greater than 0.80 indicated excellent agreement, values less than 0.41 indicated poor agreement and values in between indicated moderate agreement.19 Another approach for determining agreement between navigation and plain radiographic measures is to measure the limits of agreement.20 This calculates the range in which 95% of the errors would lie (assuming a normal distribution) and is calculated as follows: mean difference ± 1.96 × standard deviation of the differences.
Results
We calculated the variation between the results from radiographs for the measurements made by the 9 observers and the navigation technique. The errors were largest for visual assessment. The error for the navigation group ranged from −5° to +5.5°, whereas those for the observer group ranged from −18.5° to +17.5°. No measurements in the navigation group had an error of greater than 5.5°, compared with 39% of measurements in the visual assessment group that had an error greater than 5°. In total, 18% of visual observations had an error of 10° or more. The mean error from the radiographs in the navigation group was 2.18° (95% confidence interval [CI] 1.23°–3.01°), which was less than in the observer group (5.57°, 95% CI 4.86°–6.29°, p < 0.001).
There was a tendency for both methods to underestimate the amount of fixed flexion contracture, more so for the visual assessment group. When analyzing the observers’ error with respect to flexion (+) and extension (−), they tended to underestimate the amount of knee flexion (median error −4), whereas the navigation group was more evenly distributed (median error 0).
We calculated the concordance coefficient for each observer, and the navigation technique compared with the radiographic measurements (Table 1). The navigation group showed very high concordance (0.9547), reflecting that it varied little from the radiographic measurements. The mean for the concordances for the visual assessments was 0.7012 (range 0.6220–0.7906). We also determined that accuracy was not influenced by the level of experience of the observer, because there was no statistical difference between residents, fellows and staff. The mean concordance coefficient for the residents was 0.7141, the coefficient for the fellows was 0.6740, and the coefficient for the staff was 0.7153.
Concordance coefficients and limits of agreement for navigation and the 9 observers compared with radiographic measurements
The limits of agreement are listed in Table 1 and reaffirm the improved accuracy of the navigation technique compared with visual assessment. It shows the greater range of error among the 9 observers and also demonstrates that the observers tended to underestimate the amount of flexion deformity. The observers felt that the knee was less flexed than it actually was and thus potentially did not appreciate that a flexion deformity was present (Fig. 3).
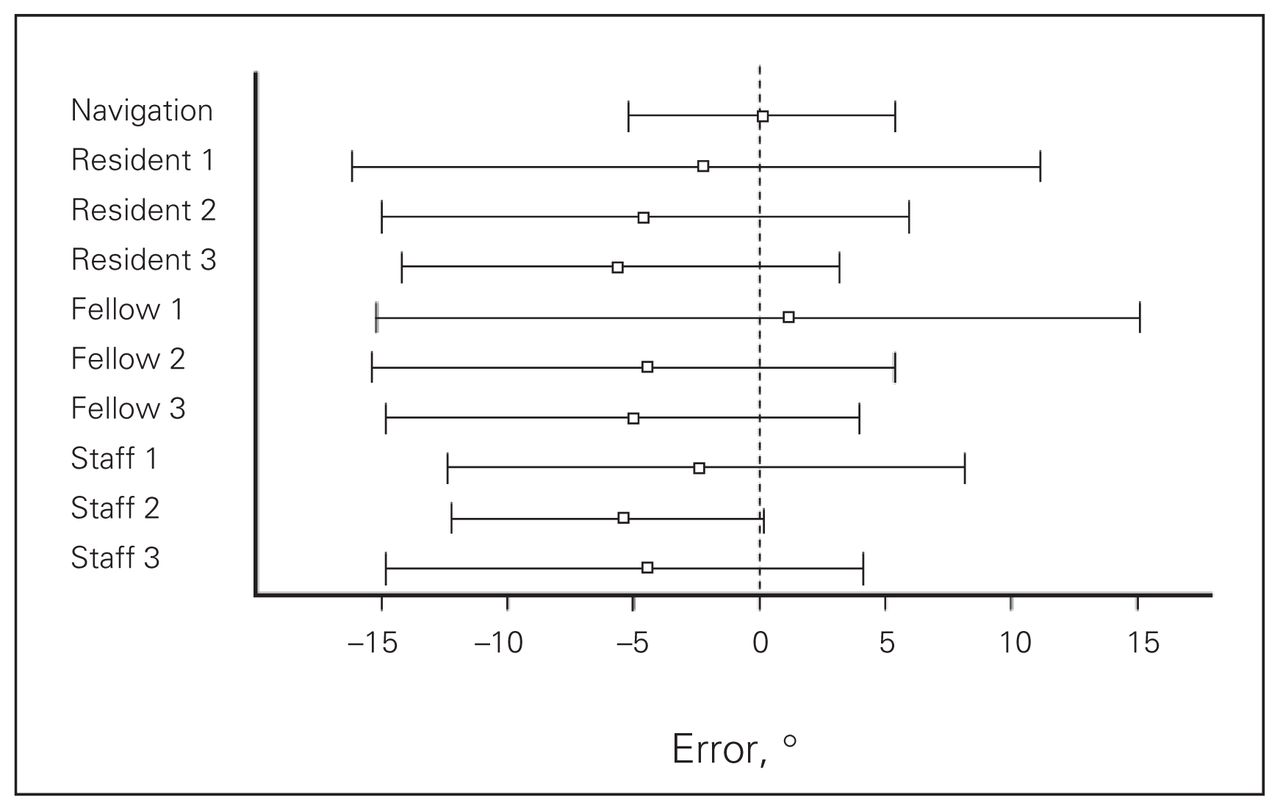
Mean error and limits of agreement for computer-assisted navigation and the 9 observers compared with radiographic measurements.
We also calculated concordance coefficients for the 3 surgeons who repeated the measurements, compared with their initial measurements. Their coefficients were 0.8875, 0.8717 and 0.8577.
Discussion
Correction of deformity (including fixed flexion) is one of the primary goals of TKA. The presence of a fixed flexion contracture before surgery has been shown to be a risk factor for the development of a fixed flexion contracture in the postoperative period.7,21,22 Thus, the ability to assess the presence and magnitude of a fixed flexion deformity is important in both preoperative planning and intraoperative decision-making in TKA. The presence of a fixed flexion contracture may impair function in patients with osteoarthritis and also in those who have received TKA.7,9 If the knee is unable to fully extend, increased demand is placed on the quadriceps because they are required to stabilize the flexed knee at heel strike and during the stance phase.5,6,9 Impaired function may result from increased energy requirements and earlier fatigue of the quadriceps, causing functional impairment, limping gait, decreased walking distance or problems with sporting or leisure activities.6,9 Fixed flexion contracture causes increased forces across the patella-femoral joint, predisposing the patient toward anterior knee pain and quadriceps fatigue pain.9 It may also lead to abnormal loading of the posterior femoral condyles and the posterior tibial plateau during the stance phase of gait.6 Fixed flexion contracture is common among patients with degenerative joint disease (up to 61% of patients).23 Despite attempted correction at the time of surgery, 8%–17% of patients have substantial residual fixed flexion contracture postoperatively.7,21,23
During surgery, numerous assessments are made to determine whether there is a fixed flexion contracture and whether it has been corrected. Traditionally, this has been done visually with the patient’s leg suspended by the ankle, and the knee viewed from the side. Numerous authors24–26 have shown visual assessment to be less accurate than the use of a goniometer. Although goniometers are used in outpatient clinics, most surgeons simply rely on visual assessment in surgery. With various obstacles to anatomic landmarks (including tourniquet and drapes), this is more difficult than when done under ideal circumstances. With the advent of CAS in TKA, numerous authors have shown improvement in the alignment of implants in the coronal and sagittal plane10–13 and, to a lesser extent, rotation.14 To our knowledge, no published articles have addressed the accuracy of CAS with regard to the assessment of fixed flexion deformity.
Our results demonstrate the inaccuracy of visual assessment in determining the presence and magnitude of a fixed flexion contracture. Computer-assisted surgery was very accurate and closely approximated our radiographic measurements. The mean error was only 2.18°, with all measurements falling within 5.5°. Visual assessment alone was significantly less accurate, with a mean error of 5.57°. Visual assessment also tended to underestimate the amount of fixed flexion, with a median error of −4°. Perhaps of more clinical significance was the amount of variation in this group, with 1 in 6 measurements having an error of greater than 10°, with a maximum error of almost 20°. This implies that there is a tendency to under-correct any deformity when visual assessment is performed, thus leaving the knee in mild flexion.
We made comparisons between 3 groups of differing clinical experience. All 3 groups performed in a similar manner, with no statistical difference in the mean error between the groups, suggesting that greater experience does not improve the accuracy of visual assessment of fixed flexion deformity. We also showed that when the measurements were repeated by 3 of the surgeons, the concordance was better than the interobserver error; however, the mean error, which was 3.5° with a maximum of 15°, is still of some concern.
Although the observers were not instructed to do so, almost all visual assessments (across all observers) were made in increments of 5°, implying that this is the level of accuracy that surgeons intrinsically feel they can achieve.
There were a number of limitations to our study. Although the limb was draped as it would be during surgery, no tourniquet was used, and the foot was not draped. The observers relied on visual assessment only. In normal surgical practice, there is the added input from tactile feedback as the knee is put through a range of motion and held in “full” extension. Despite this, the measurements for visual assessment were similar in accuracy to other published series.25,27 Resources limited the sample size to 14 specimens; however, the differences we observed were statistically significant. Greater numbers may have allowed us to compare accuracies at different levels of flexion. We also accept that error may have been introduced during the measuring of the flexion angle from the radiographs.
In conclusion, this study highlights the inaccuracy of relying on intraoperative visual assessment during TKA to determine whether a fixed flexion deformity exists. This study also demonstrated that the use of CAS provides a more accurate and reliable method of determining whether a flexion deformity is present. The use of CAS may therefore provide surgeons with the information required to more consistently restore full extension during TKA. Further study is needed to confirm that this will result in better functional outcomes and improve patient satisfaction following TKA.
Acknowledgement
The authors acknowledge the assistance of Dr. Rosane Nisenbaum, PhD, Centre for Research on Inner City Health, St. Michael’s Hospital, Toronto, in performing the statistical analysis.
Footnotes
Competing interests: None declared for Drs. Gallie, Davis, Macgroarty and Waddell. Dr. Schemitsch has received paid consultancy from Stryker.
Contributors: Drs. Gallie, Davis and Macgroarty designed the study and acquired and analyzed the data. Dr. Schemitsch helped design the study, and both he and Dr. Waddell analyzed the data. Drs. Gallie and Davis wrote the article. All authors reviewed the article and approved its publication.
- Accepted February 21, 2009.
References
In this issue

Article tools


Related Articles
Cited By...
- No citing articles found.